Power BI
“Power BI - Bring your data to life!”
About Power BI –
Microsoft Power BI is a collection of online services and features that enables you to find and visualize data, share discoveries, and collaborate in intuitive new ways in the form of reports and dashboards.
Microsoft Power BI Integrations
Using the Microsoft Power BI Integrations, you can import data that is massive from various sources into Power BI desktop. You can very well edit the data or plan on modifying it after importing to your system.
Power BI Services –
The Microsoft Power BI Service sometimes is referred to as Power BI or app.powerbi.com. You can stay up to date with all the necessary information that really matters to you. Power BI solution will help you overcome most of the problems you are facing with ease.
The CloudFronts Power BI team has deep expertise delivering complex analytics requirements on the Power BI platform. Our team has experience working across various industries from Manufacturing to Services and with clients around the globe.
The CloudFronts Power BI team has deep expertise delivering complex analytics requirements on the Power BI platform. Our team has experience working across various industries from Manufacturing to Services and with clients around the globe.
Power BI Analytics -
Microsoft Power BI Analytics, in a nutshell, is nothing but a suite of analytics tools that are useful for a business. Users can both analyze the data as well as share insights to others using this software. Companies will have better control over their businesses. Rich dashboards that appear on any device will assist you in helping you get the necessary answers with ease.
Data warehouse Architecture
- Data extraction from Different Source System (CRM, Dynamics AX/NAV, Oracle, SQL, ERP)
- Data Transformation as per business need
- Mobility
- Data Cleaning based on the Source data structure
- Defining Data Modelling and Data mining
KPIs, Reports and Dashboards
- Define individual KPIs Using Tabular Model or Predictive analysis
- Real-time or periodic Data refreshment inside the Dashboard
- Row Level security for entire business hierarchy to access individua data
- Marketing/Financial/Sales Reports with SSRS 2016 within Power BI
- High Level Executive Dashboard for Quick Management Decision
- Predictive Analytics
Check out this to know how we deployed robust analytics on the Power BI platform for Magic Bus.
Download Case Study >>Custom Visuals
Enhance your Power BI Dashboards with custom visuals. The CloudFronts team has created several custom visuals for specific client requirements.
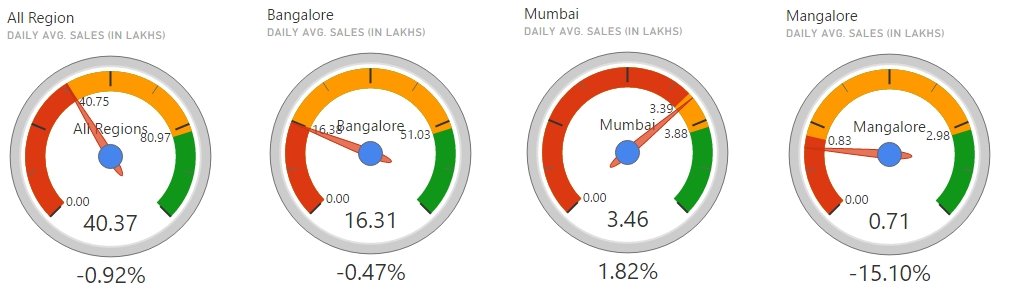

One example is our DialGauge custom visual which is used by several customers around the world. You can read more about this in this Microsoft blog.
Power BI Embedded
- Easily author interactive reports without writing any code using Power BI Desktop
- Ensure consistent high-fidelity data experiences on any device
- Easily embed interactive visuals in your app using REST APIs and the Power BI SDK
- Choose modern visualisations out-of-the-box or customise without building them from scratch for your reports
- Use your existing authentication and authorisation methods
- Speed up time to value without redesigning your existing app
- Pay only for what you use with no upfront costs
“ We had a positive experience with CloudFronts. The team was engaged, committed and worked hard to deliver a quality product, on-time. The team has delivered the solution along expected lines. It was easy to coordinate with the delivery team and since both the developers were working out of our office, it made the interaction and coordination easier. ”
— Raghunandan Hegde, Senior Project Manager, Magic BusWhy CloudFronts?
CloudFronts Technologies is a Dynamics 365, Power BI and Azure focused Microsoft certified Gold Partner. We help companies around the globe deploy their business processes on the Dynamics 365 platform.
Get access to Data-Ready Blueprint
Turn complex data into future-ready AI solutions

Anil Shah, CEO
Lorem ipsum dolor sit amet, consectetur adipiscing elit. Ut elit tellus, luctus nec ullamcorper mattis, pulvinar dapibus leo.