Optimizing Project Impact: Continuous Monitoring of Client System Utilization for Enhanced Value Deliver using Business Central
Introduction:
It is crucial for the management team to track the client’s utilization of the system as a key metric for assessing the project’s success and the value it brings to the client. To facilitate this monitoring process, I have developed a utility that can automatically generate and send reports to the management team, detailing the number of records created in specified tables.
For example, during the initial master data upload phase, 1500 data added into the Customer table. Subsequently, over the following month, this figure increased to 1750 and then to 1950. Such trends signify that the client is utilizing the system in line with expectations.
Pre-requisites:
- Business Central Online or On-Premise
Configuration:
Usage Statistics Setup Page:
This page, contains two main fields:- Collect Statistics (Boolean) and Mail Recipients (which contains email id’s to which the report has to be send) and one more field that is primary key field is added in table but not in page and it is set to code due to which the header we get as required in Usage Statistics Setup Page. The datatype of the field primary key is set to header because the default number of code is null. Regex is used for pattern matching.
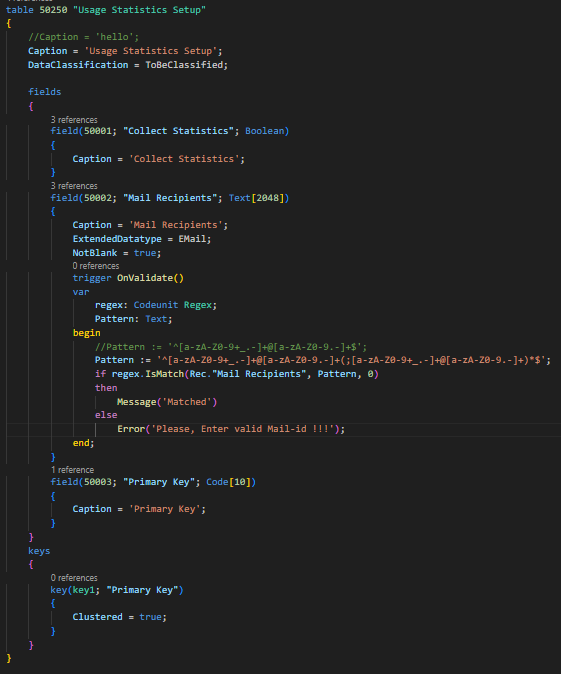

Here, email validation is added on Mail Recipients. User can enter multiple email addresses in this format eg. abc@gmail.com;xyz@gmail.com.
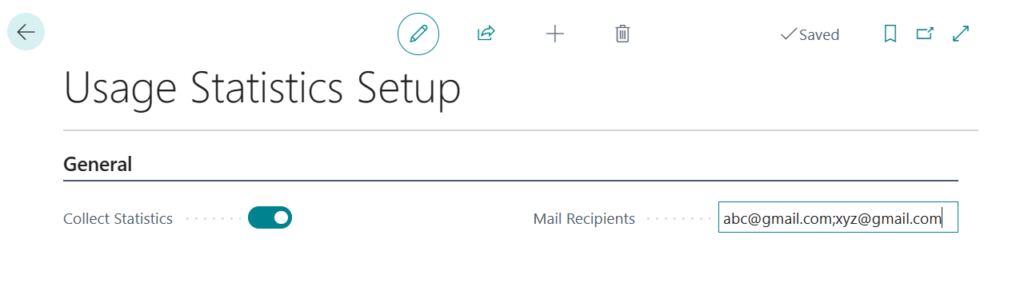
If the Collect Statistics is enabled than only you can process further and there should be at-least one mail id present in Mail Recipients.
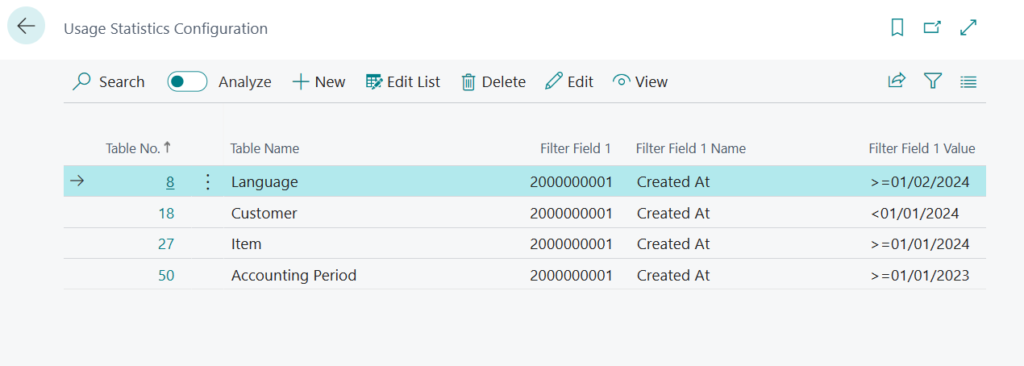
Usage Statistics Configuration Page:
This page contains the actual data from which the data will be passed and report will be generated.
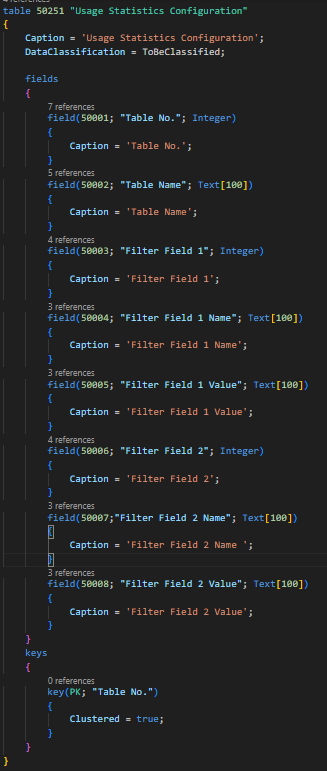
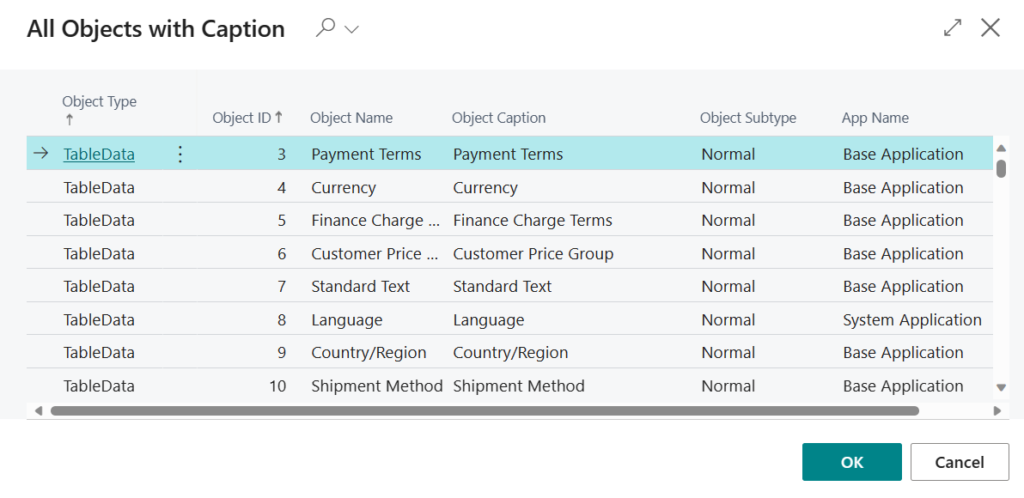
The list and the card pages are also created with same fields. The “All Object With Caption” is used for viewing all object details in the system. The trigger lookup is used to get the table no. and table name at runtime.
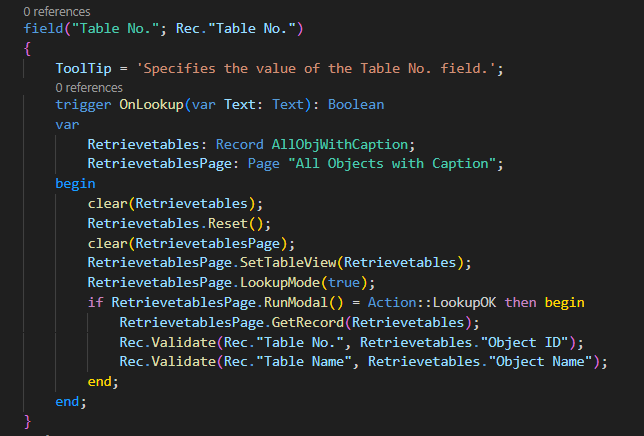
After fetching the specific table no. and table name, fields will filter according to the filter field 1 value, same goes for filter field 2 value. (filter field 2 is added according to the requirements.)
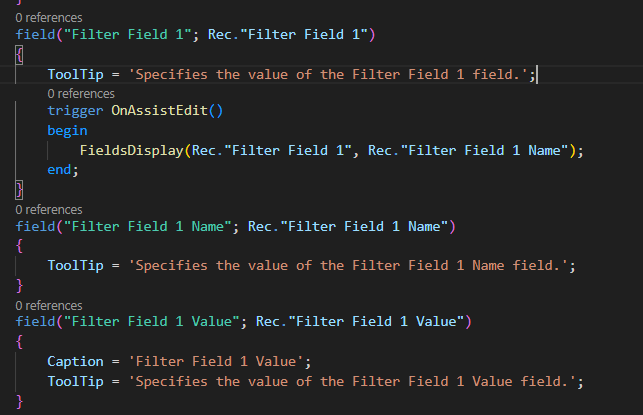
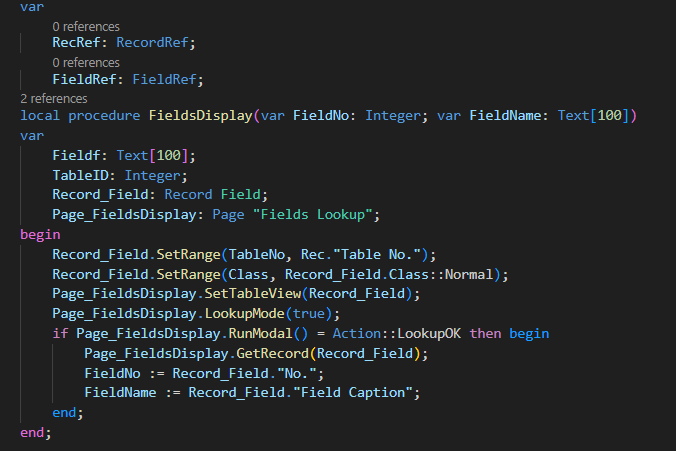
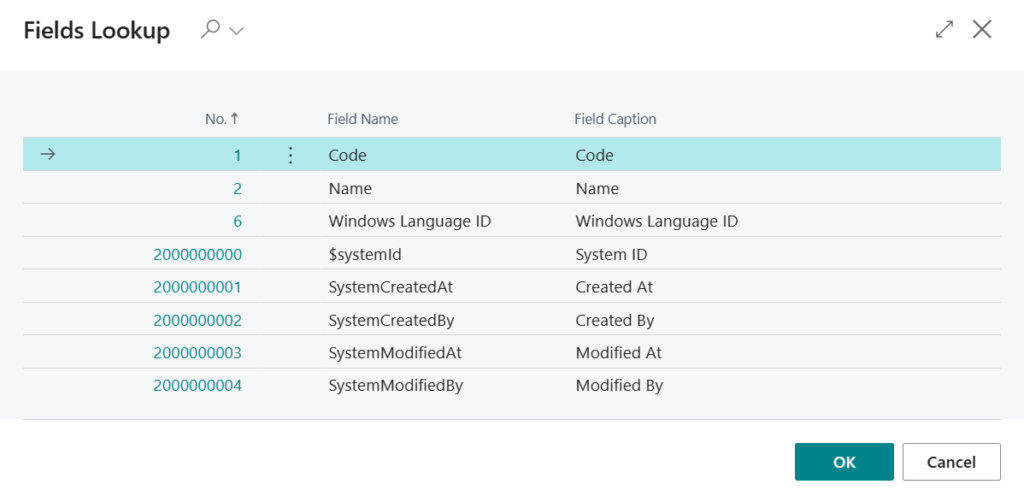
The FieldsDisplay procedure is used to retrieve field no. and field name of the according to its record.
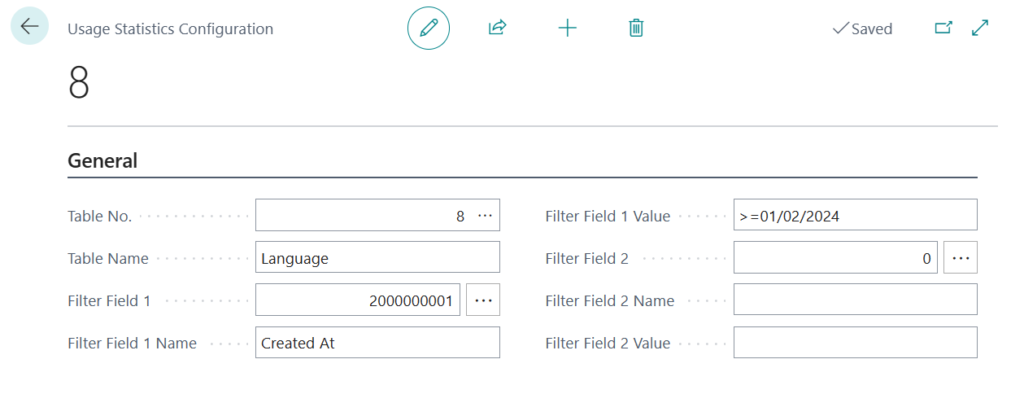
In Filter Field 1 Name any field can be selected and filter field 1 value must be set according to that field.
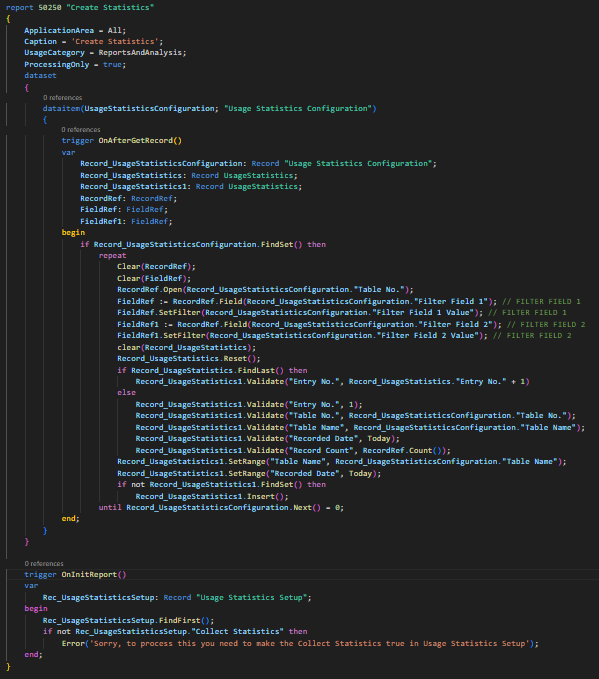
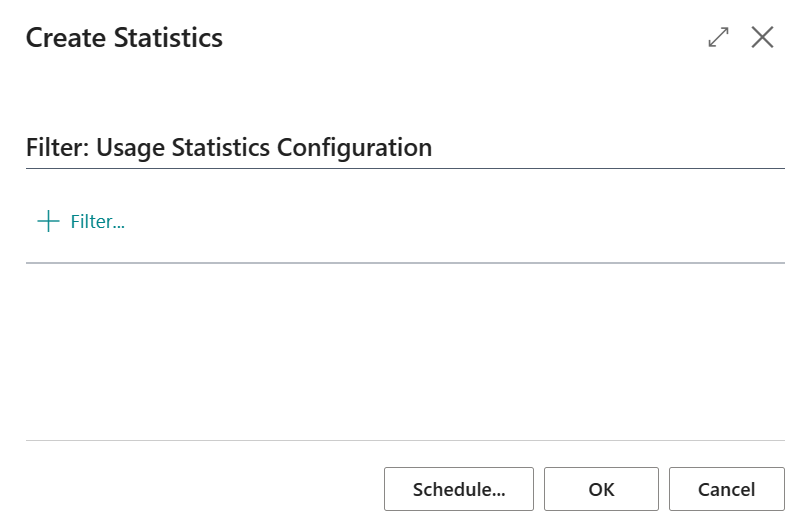
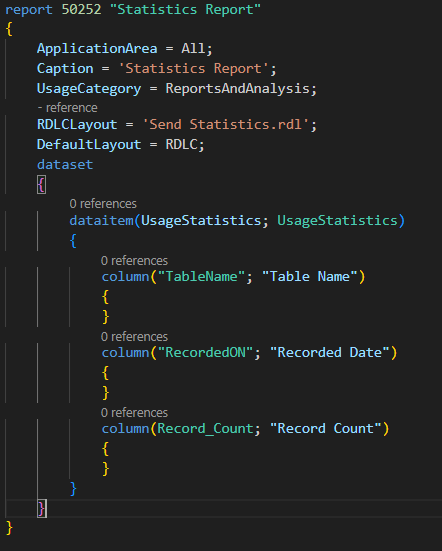
Create Statistics Report:
This report is designed to automate the generation of usage statistics based on configurations specified in the “Usage Statistics Configuration” table. The report is flagged as “ProcessingOnly,” indicating it is intended for background processing rather than direct user interaction. The dataset within the report contains a data item with an “OnAfterGetRecord” trigger, which executes after each record is retrieved. This trigger is responsible for processing each configuration record, applying filters, and updating or inserting records into the “UsageStatistics” table. Additionally, the report features an “OnInitReport” trigger that checks the “Usage Statistics Setup” table to ensure that statistics collection is enabled. If this condition is not met, an error message is displayed, and the report exits. In essence, this report streamlines the creation of usage statistics in Business Central, adhering to specified configurations and ensuring the necessary setup conditions are satisfied before processing.
Usage Statistics Page:
After filter the number of records the data which will be generated will be displayed in this table.
List will also be created with same fields.
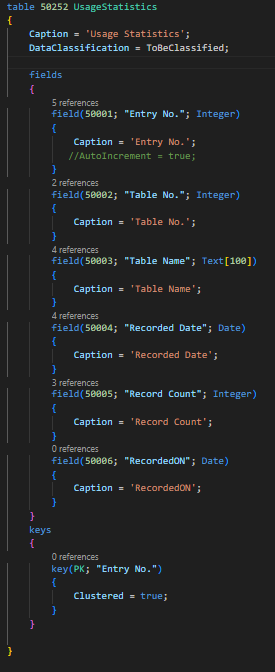
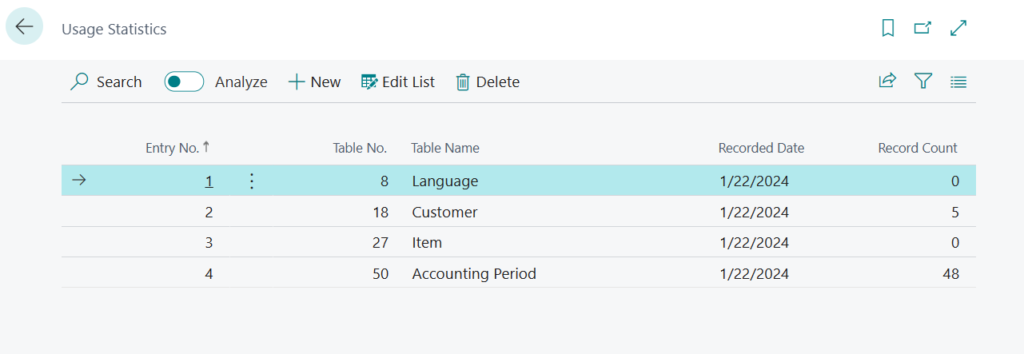
In Record Count the number of values are there which satisfies the filter condition.
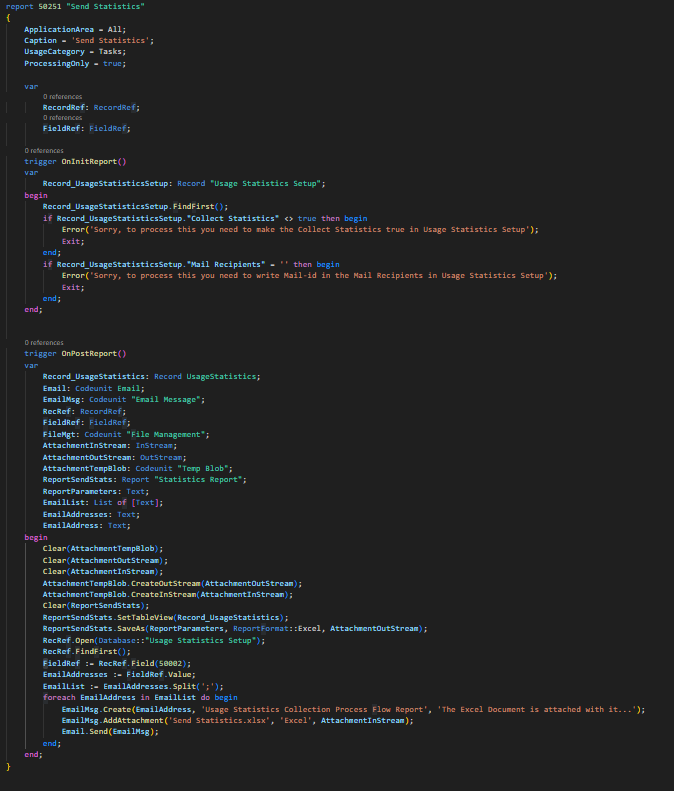
Send Statistics Report:
This report is designed to send usage statistics via email. Let’s break down the code:
The report begins with specifications such as its application area, caption, and usage category. Notably, it is marked as a “ProcessingOnly” report, indicating it is intended for background processing rather than direct user interaction.
The OnInitReport trigger executes when the report is initialized. It checks settings in the “Usage Statistics Setup” table, ensuring that statistics collection is enabled (“Collect Statistics”) and valid mail recipients are specified (“Mail Recipients”). If these conditions are not met, error messages are displayed, and the report exits.
The main functionality is in the OnPostReport trigger, which executes after the report is processed. It performs the following steps:
- Retrieves settings from the “Usage Statistics Setup” table.
- Generates an Excel report using the “Statistics Report” layout and saves it to an OutStream.
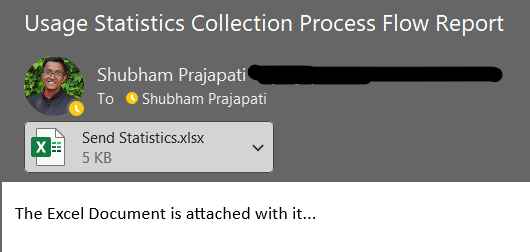
- Retrieves email addresses from the setup, splits them into a list, and sends the report as an attachment to each recipient via email.
- The email includes a predefined message and the attached Excel document.
Excel Sheet:
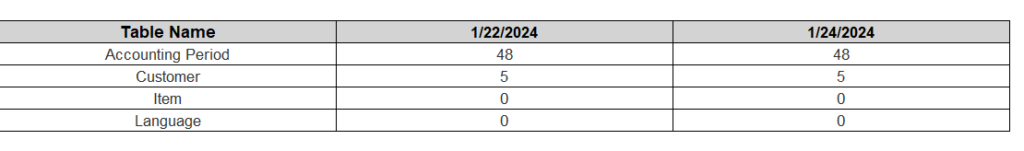
In this, on 22nd date after applying the filters the output is given and on 24th it again checks by applying same filter since new data was not added in the respective table that’s why it is showing the same data.
Conclusion
In conclusion, the automated reporting tool plays a pivotal role in monitoring client system utilization, revealing encouraging trends such as the gradual increase in customer records. These insights affirm the project’s success and underline its value to the client, reinforcing our commitment to proactive monitoring for continual optimization and client satisfaction.
