How to use decomposition tree in power BI
In this blog we will see how to use decomposition tree in power BI
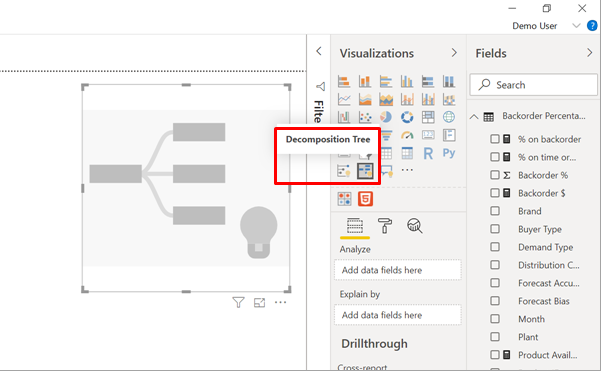
The decomposition tree visual in Power BI lets you visualize data across multiple dimensions. It automatically aggregates data and enables drilling down into your dimensions in any order. This makes it a valuable tool for ad hoc exploration and conducting root cause analysis
Step 1: Open Power BI and select decomposition tree visual.
Step 2:
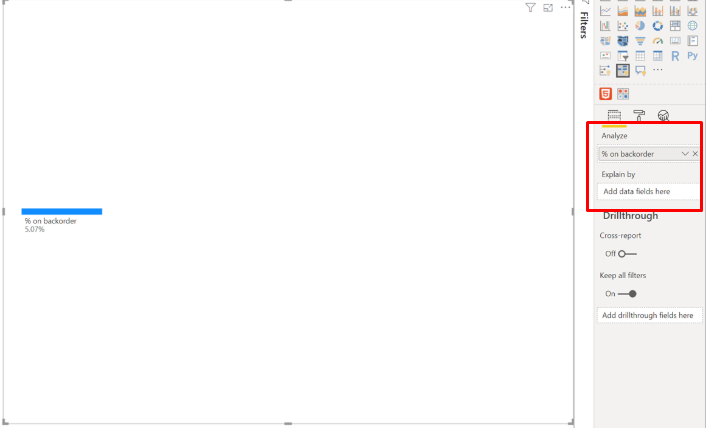
The visualization requires two types of input.
Analyze – the metric you would like to analyze. This has to be a measure or an aggregate.
Explain By – one or more dimensions you would like to drill down into.
Once you drag your measure into the field well, the visual updates showcasing the aggregated measure
Step 3: Add one more dimension from your data to add further drill down. Notice that a plus sign appears next to your root node once you add the field.
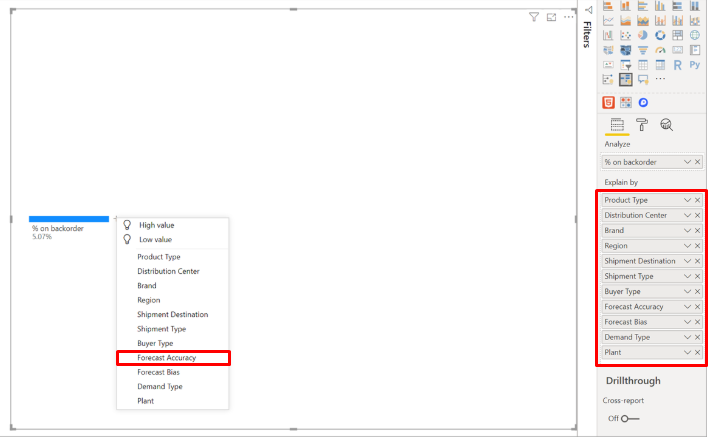
Step 4: Now if you select forecast Accuracy results in the tree expands and breaks down the measure by the values in the column. This process can be repeated by choosing another node to drill into.
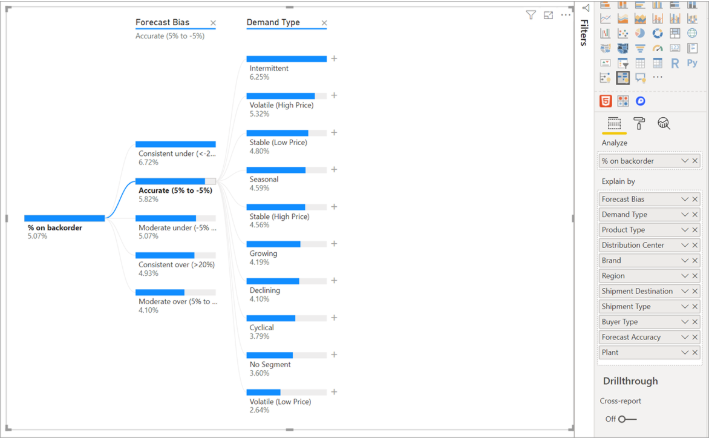
If you select a node from the last level will cross-filter the data. Selecting a node from an earlier level changes the path. Hope this helps.
