Multi-select data elements using Power BI Desktop on Visuals
Introduction:
In latest Power BI update, Microsoft introduced new feature as Multi-select data elements on visuals.
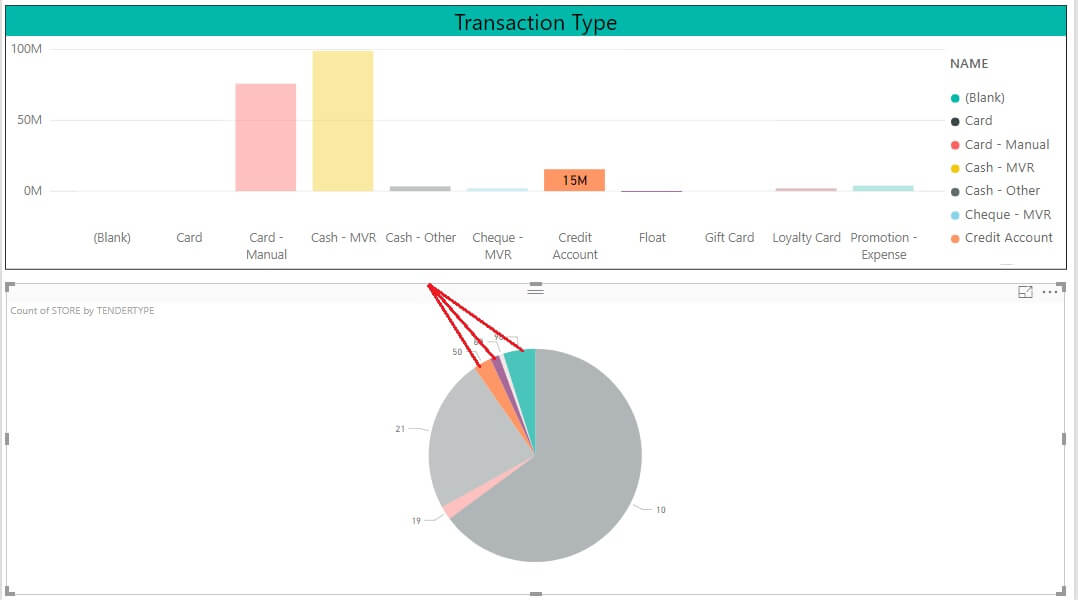
In Power BI Desktop, we can highlight a data point on visuals by simply clicking on the data point in the visual. Means, if we have an important bar chart, and we want other visuals on the report page to highlight data based on our selection, we can click the data element in one visual and see results reflected in other visuals on the page. This is basic. Till now we are only able to filter the data on single-select highlighting. See below screen capture:
New feature:
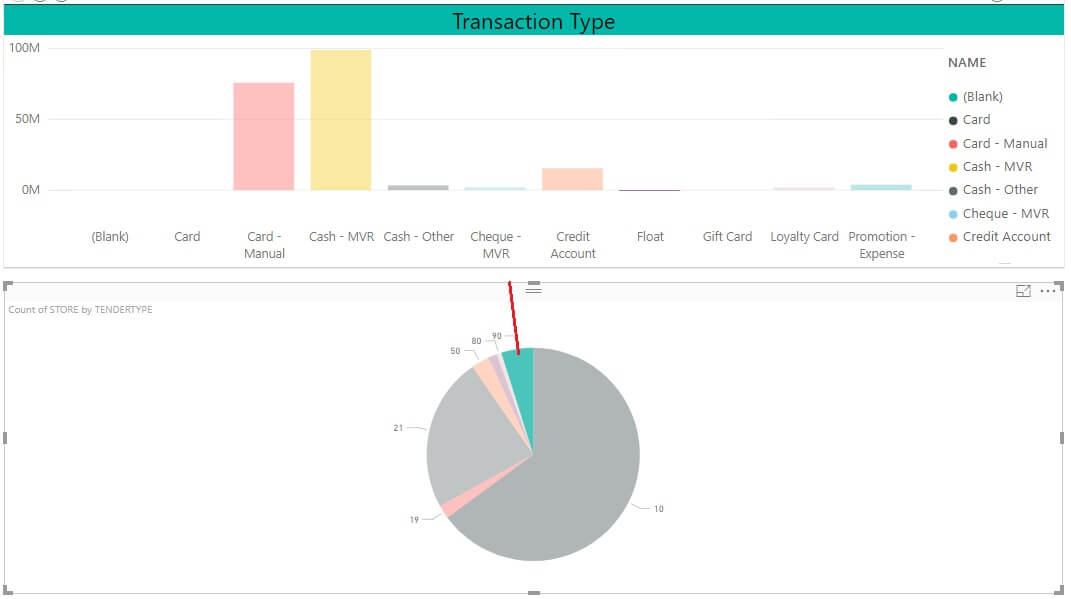
But by using the new feature of the Power BI we can multi-select data element on visuals, we can now select more than one data point in Power BI Desktop report page, and highlight the results across the visuals on the page. To multi-select data points in visuals, simply use CTRL+Click to select multiple data points. See below screen capture for multiple data points select on visual(multi-select):