“What If” Parameter in Power BI
This blog will explain how to use “What If” Parameter in Power BI desktop. Via What If parameter in Power Bi can easily give you the ability to dynamically transform your data.
Using this parameter will allow to demonstrate how your data change under various scenarios. For example, how much revenue would you have if your products were at 5%, 10% or 15% of the retail price. Another scenario would be to show create a marketing mix to show how profit would change due to different investment in each channel and also if company increased or decreased its budget then how the revenue amount will be change etc.
How to use What IF parameters in Power BI
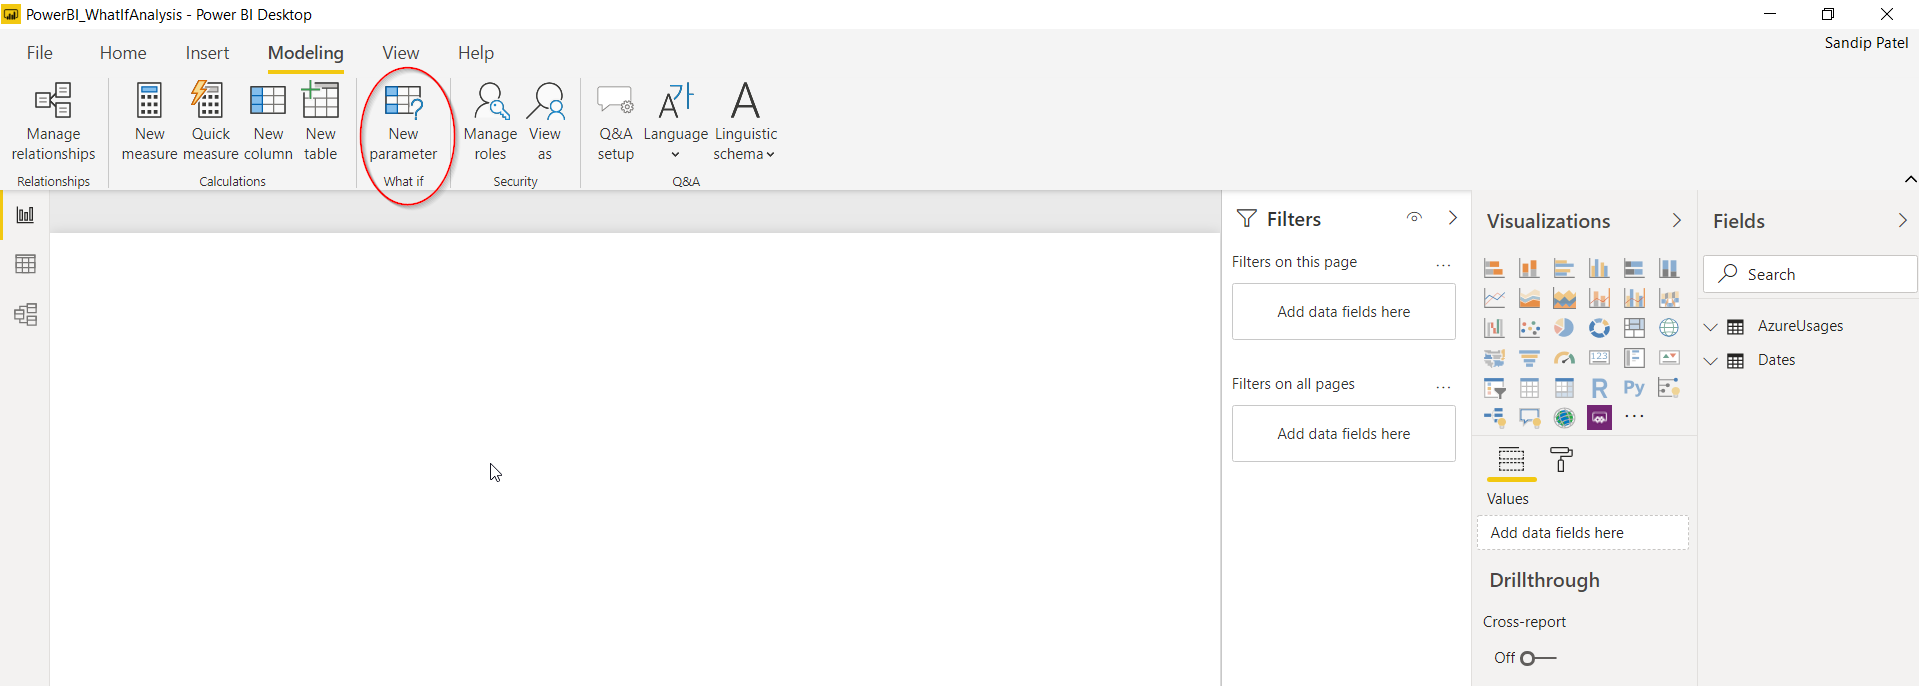
Step 1: Click the Modeling tab in the top ribbon.
Step 2: Click the What IF parameter from the top ribbon.
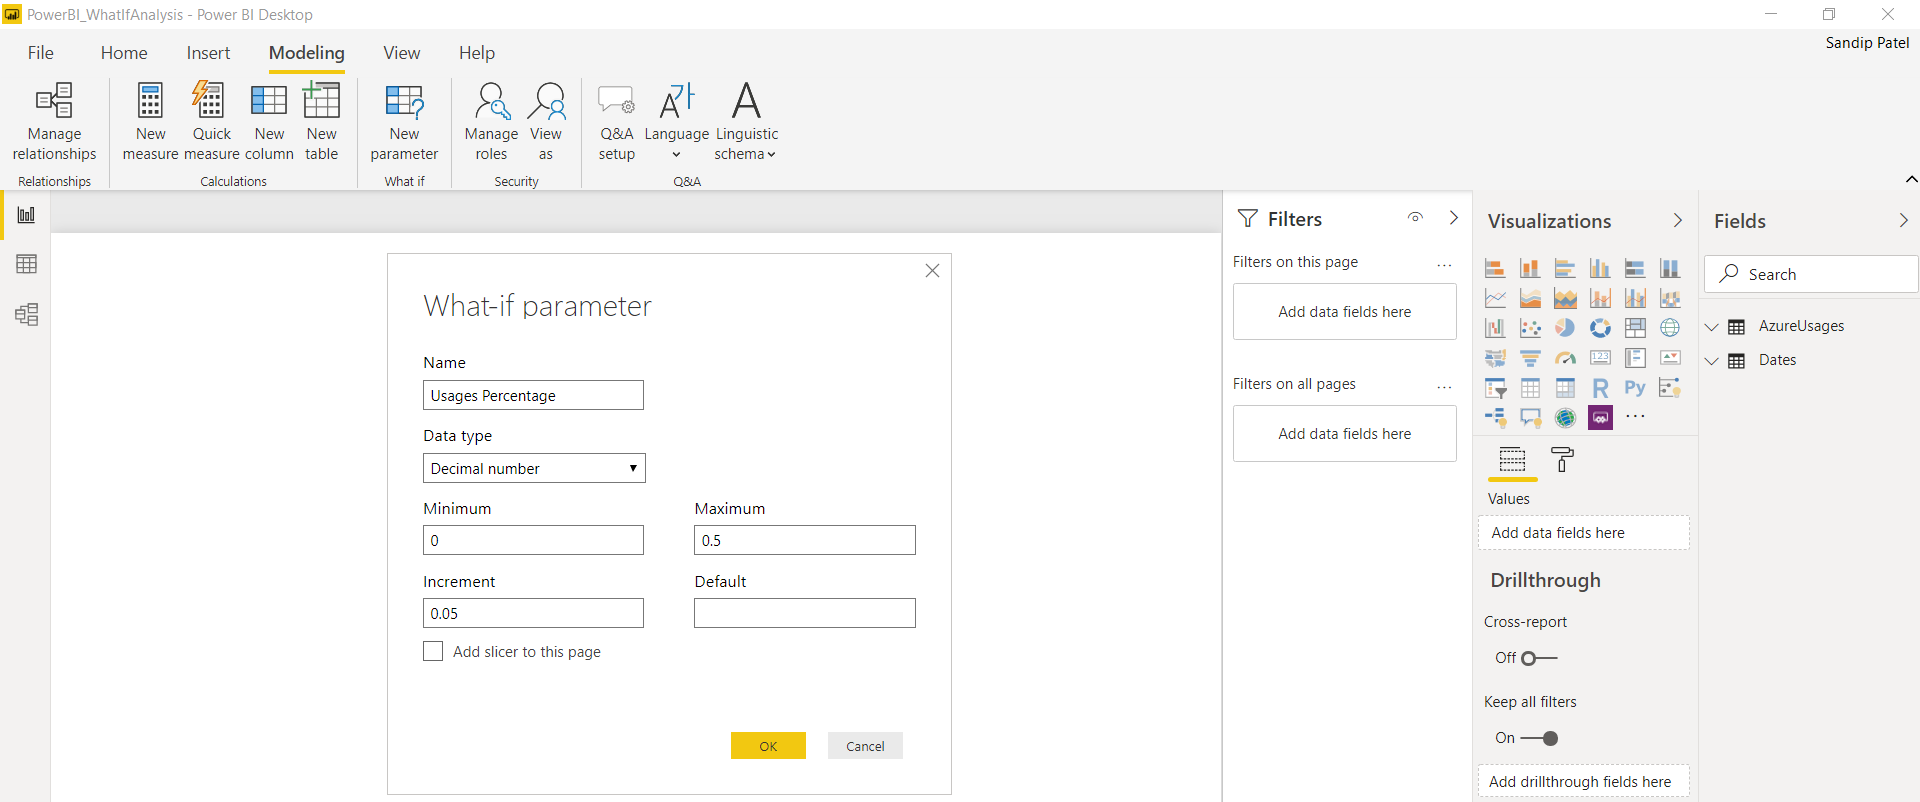
Step 3: The What If parameter window will open, provide details such as Name, Data Type, Minimum, Maximum and Default number.
Step 4: Lastly, you can add an optional slicer.
Step 5: A table with a calculated measure will be created
- A generated series that spans the specifications of your parameter.
- A selected value function that changes as the parameter changes.
Let’s do it practically
Scenario: You have a list of Azure usages details like server name, VM name and cost. Company would like to create a parameter that allows them to apply usage so that company can see the overall cost of each year when different usages are applied. Company would like to have a parameter that spans from 0% to 50% with a 5% increment.
You can see how this parameter is created by viewing the new table:
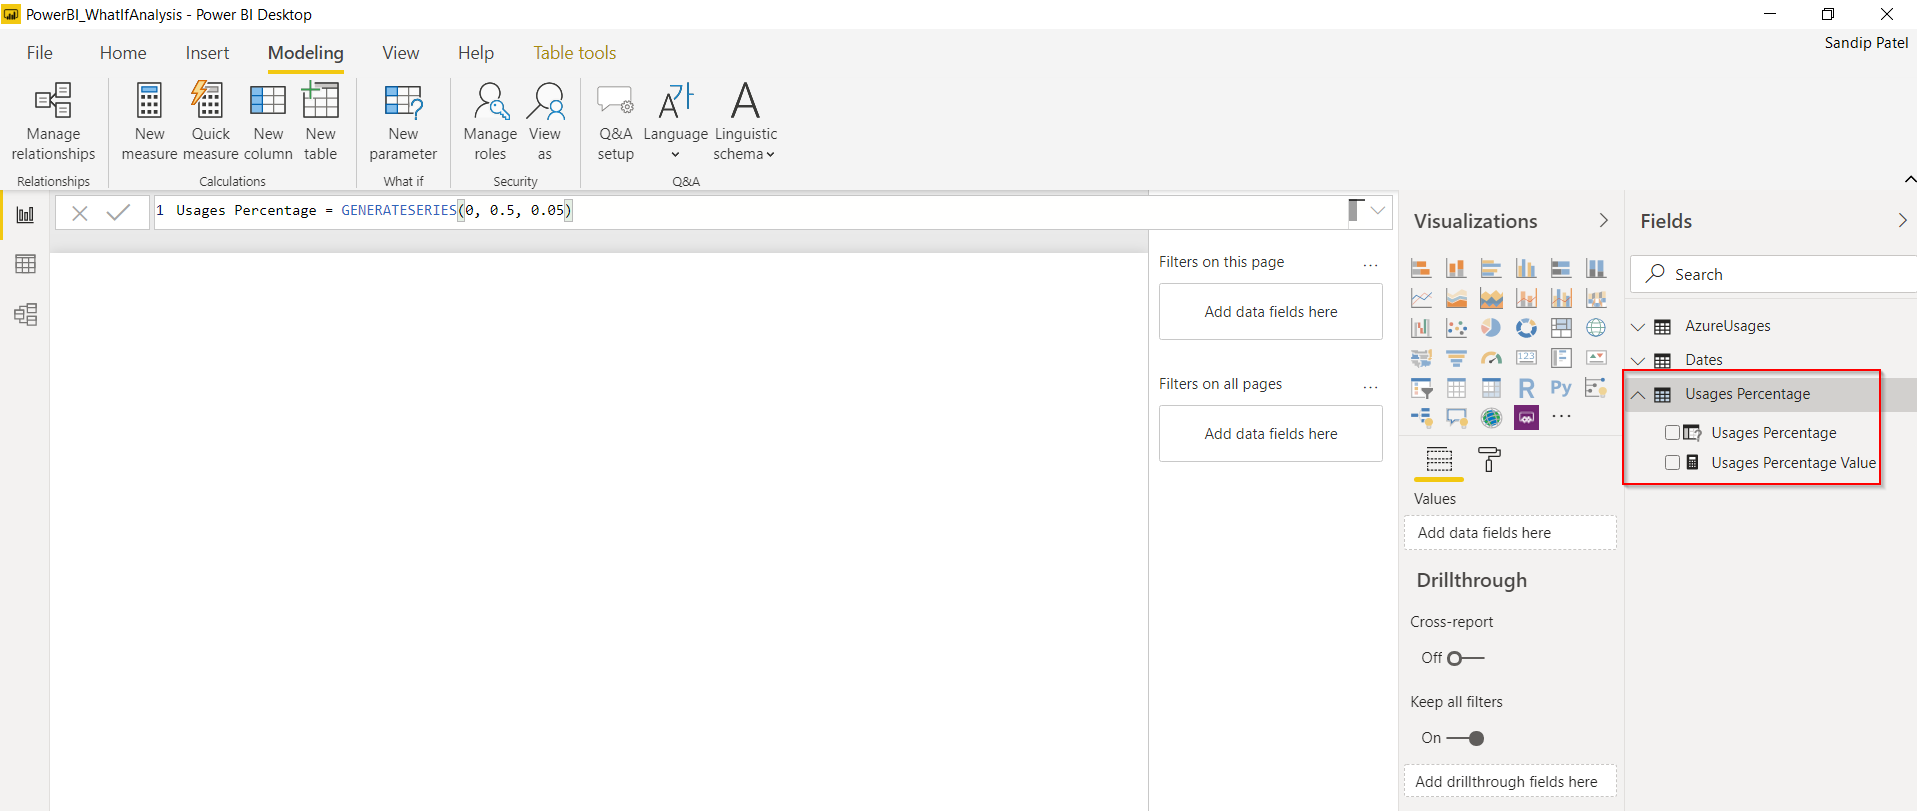
Once the What If parameter is created you have your generated series that looks like:
Usages Percentage = GENERATESERIES(0, 0.5, 0.05)
And you will have a selected value functions that looks like this:
Usages Percentage Value = SELECTEDVALUE(‘Usages Percentage'[Usages Percentage],0)
Both of these are automatically created for you.
Apply the parameter to your data
In this case, company want to apply the usage to total cost. This can be easily done with a calculated measure.
Usages = SUM(AzureUsages[TotalCost])*’Usages Percentage'[Usages Percentage Value]
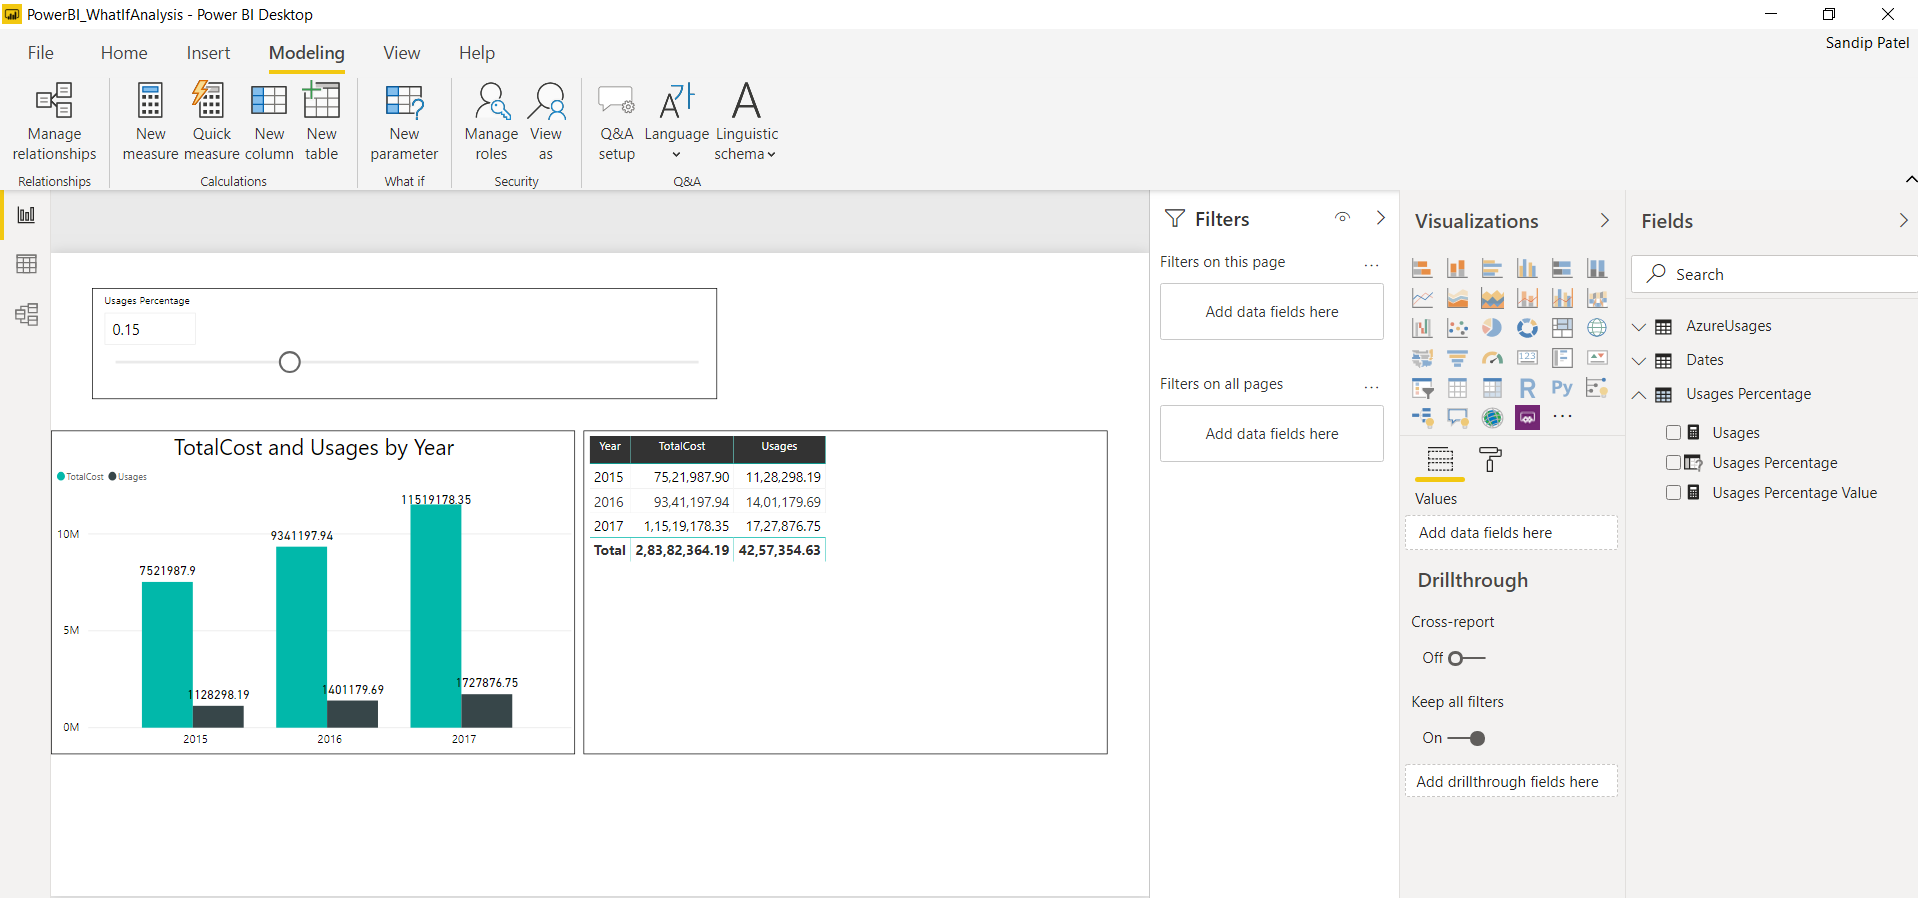
The final result you can pull into a cluster column chart or table so that company can see how the cost is affected by the usage parameter as you slide it to different usage values.
I hope this is helpful.
Check out my other blog here https://www.cloudfronts.com/embed-secure-power-bi-report-using-python-web-application-with-flask-in-visual-studio-2015/
