How to bring “AI” to Power BI
The February 2019 release of Power BI Desktop unveiled a new, out-of-the-box visual to Power BI called Key Influencers. Key Influencers is Power BI’s first Artificial Intelligence (AI) powered visualization. Microsoft has long incorporated AI capabilities in Power BI through features such as Natural Language (Q&A) and Quick Insights. However, with Key Influencers report developers now have explicit control in leveraging AI to discover insights in their data. Even more, Key Influencers is essentially multiple visuals baked into one!
The Key Influencers visual is comprised of two tabs: Key Influencers and Top Segments.
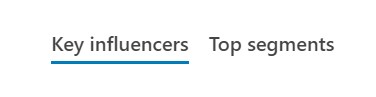
The Key Influencers tab will display a ranked list of the individual contributing factors that drive the selected condition. The Top Segments tab will take this a step further and display groupings of key influencers and their impact on the selected condition.
The Key Influencers tab runs a LOGISTIC REGRESSION to analyze your data and identify the main factors that influence a specific metric or condition.
Scenario:
The customers of a company are using a particular cloud service. The Product Manager of that company wants to conduct a survey and analyze factors (Key Influencers) that drive the customers to provide a negative feedback i.e low rating after using the cloud service.
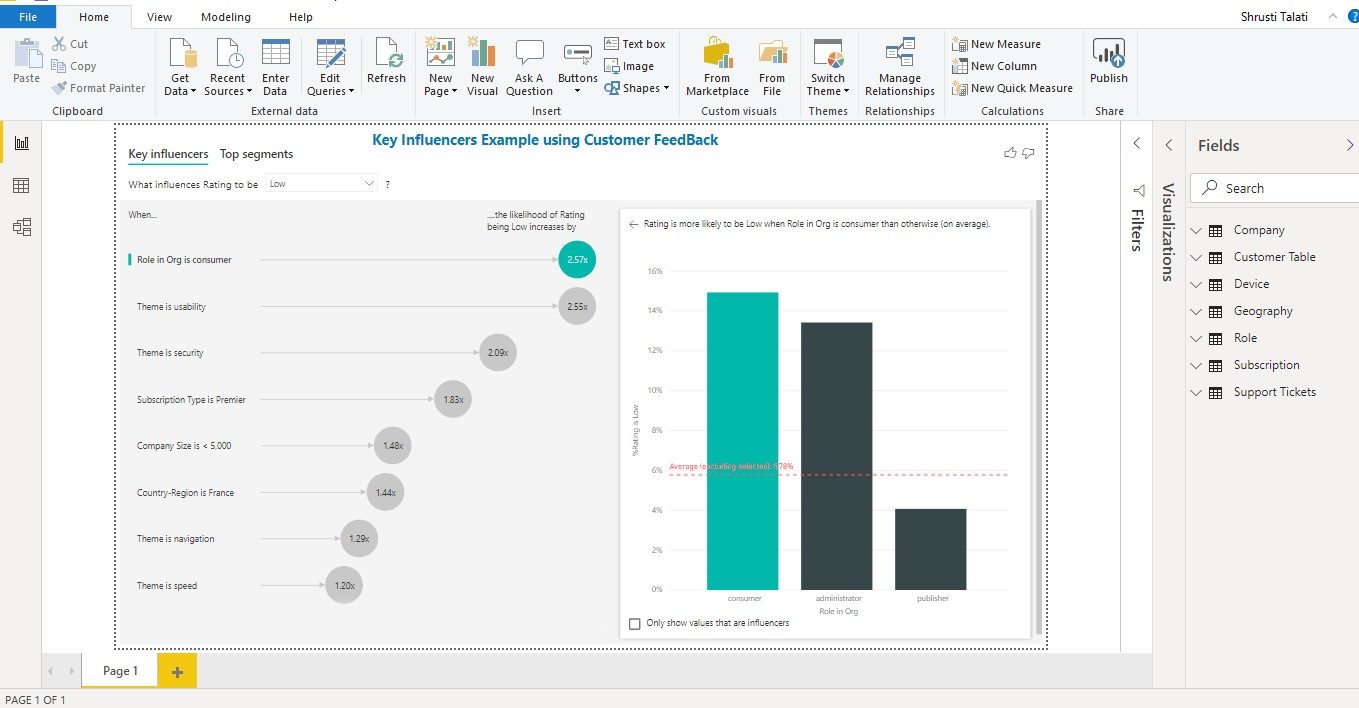
KEY INFLUENCERS TAB
The Top Influencers are:-
- Role in Org is consumer
The people whose role in the organization is consumer have 2.57 times more chances to provide negative feedback than people whose role is adminstrator or publisher.
2. Theme is usability
Second most influencing factor is Theme is usability which means the most negative reviews are provided for Usability.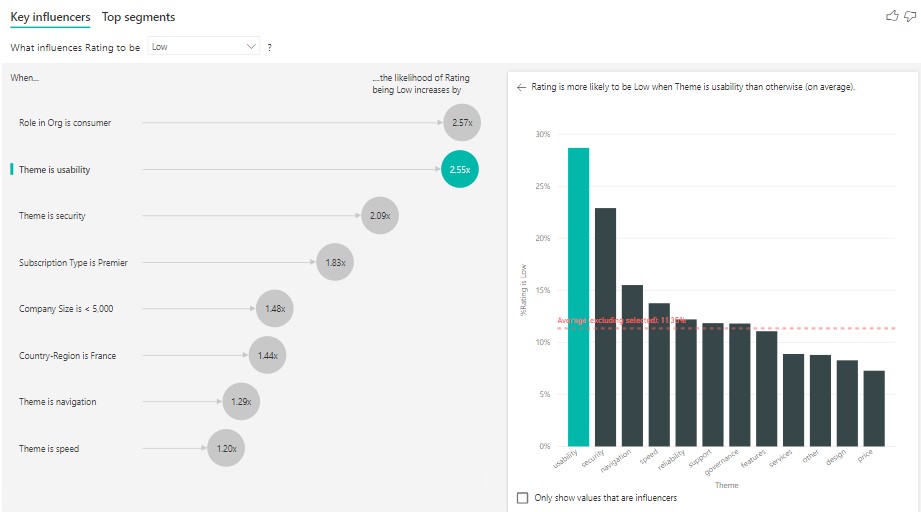
All the Key Influencers tab gives us two panes of visuals. For example, on the left-hand pane you have an infographic of the key influencers themselves, ranked based on their relative impact on the condition being analyzed
And the right-hand pane will display a chart containing the values of that attribute, along with the average percentage that value matches the condition.
All these factors change continuously depending on the parameters.For example if we add a slicer of company size, the top influencers will change-
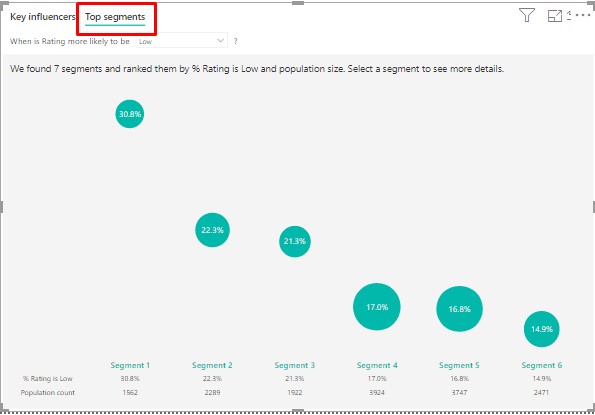
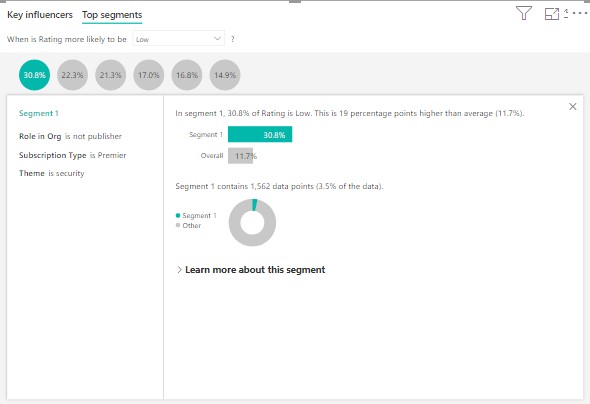
TOP SEGMENTS TAB
On the Top Segments tab, you will see how groupings of key influencers affect the selected condition. The segments are ranked based on the percentage of records where the condition is met. The size of each segment bubble represents how many records (population count) are in the segment.
LIMITATIONS
The key influencers visual has some limitations:
- Direct Query is not supported
- Live Connection to Azure Analysis Services and SQL Server Analysis Services is not supported
- Publish to web is not supported
- .NET Framework 4.6 or higher is required.
Hope this is helpful!
For more such posts visit- https://www.cloudfronts.com/why-you-should-migrate-from-excel-to-power-bi-for-reporting/
