Natural Language Q&A in Power BI
Introduction:
Power BI comes with a powerful language recognition engine that lets you ask questions of your data using conversational phrases and questions. Based on these questions, Power BI dynamically creates charts and graphs. For example, if the data is defined as a date type, it is more likely to be displayed as a line chart. Data that is categorized as a city is more likely to be displayed as a map.
Questions can be asked on a dashboard. The feature is called as Q&A or Questions & Answers. Natural Language Q&A is really an underused tool in Power BI despite of being really powerful.
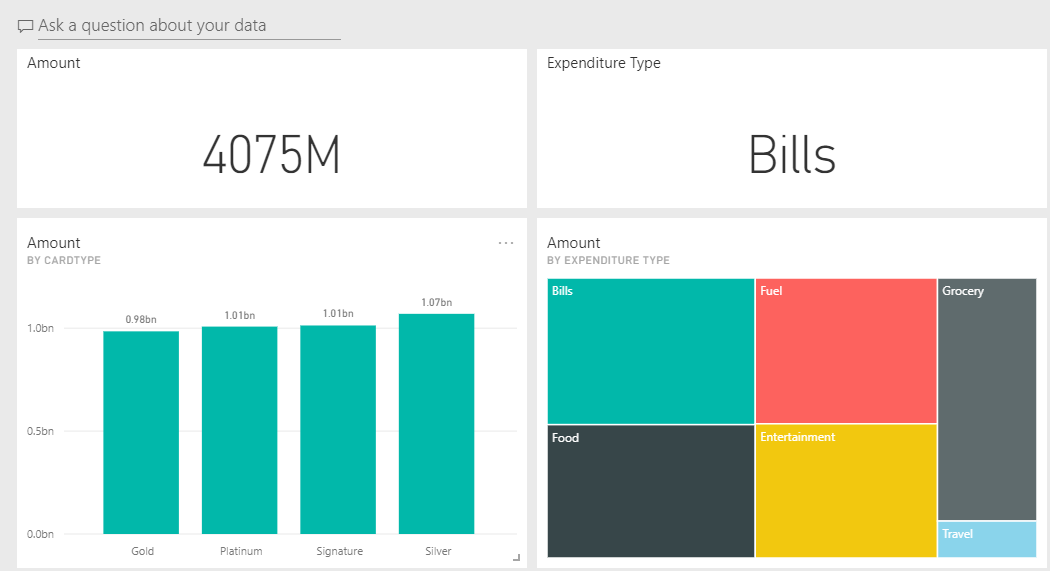
Following is my dashboard on a Credit Card transaction dataset. I will be performing simple Q&A questions on this dashboard.
Pre-Requisites:
Power BI Subscription
Features of Q&A:
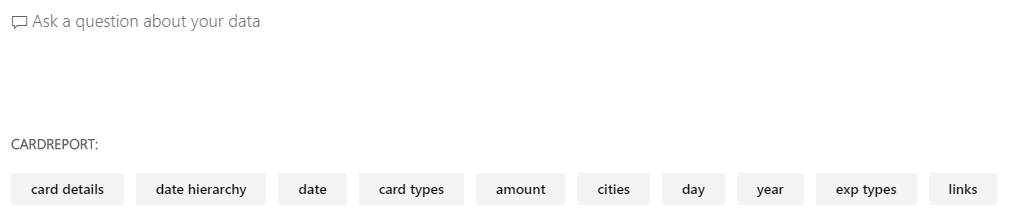
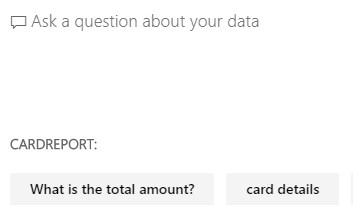
- Auto Prompts:
This prompts are created on the basis of:
a. the questions used to create tiles that are already pinned to the dashboard, and
b. the name of tables in the underlying dataset(s).
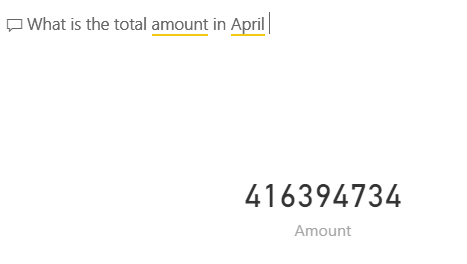
Can build a question using the prompts (Eg. What is the total amount in April)
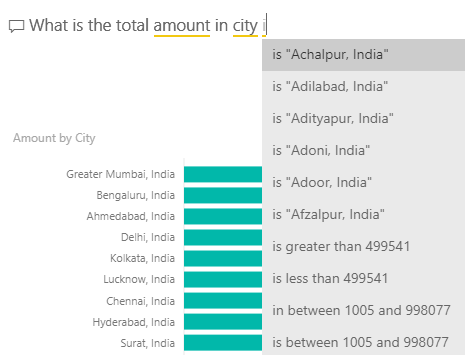
- Dropdown pops up while typing a question. Helps with auto-replacement terms as well.
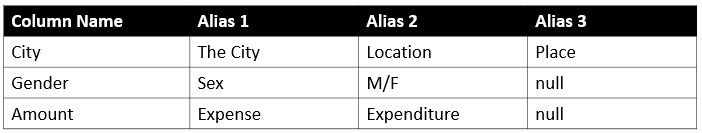
- Can use Aliasing table to make querying more powerful.
- Featured Q&A Questions
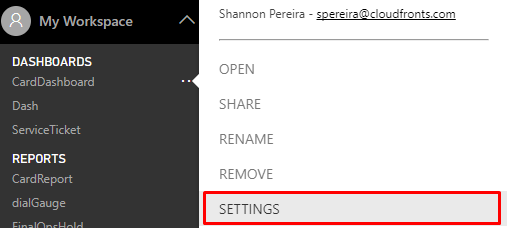
- Click on your Dashboards Ellipses and then select Settings.
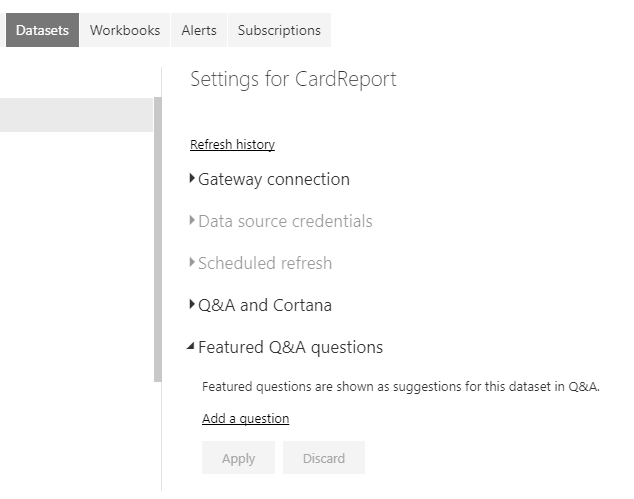
- Click on the Datasets tab and select Featured Q&A questions.
- Select Add a question and type a question and then click on Apply.
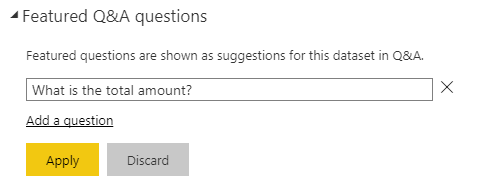
- Now whenever a user starts typing on Q&A they will be prompted with this question first.
- Click on your Dashboards Ellipses and then select Settings.
- Dims words it does not understand.

- Can combine results from more than one data set. When you type a query, Power BI looks for an answer in any dataset that has a tile on that dashboard. If all the tiles are from datasetA, then your answer will come from datasetA. If there are tiles from datasetAand datasetB, then Q&A will search for the best answer from those 2 datasets.
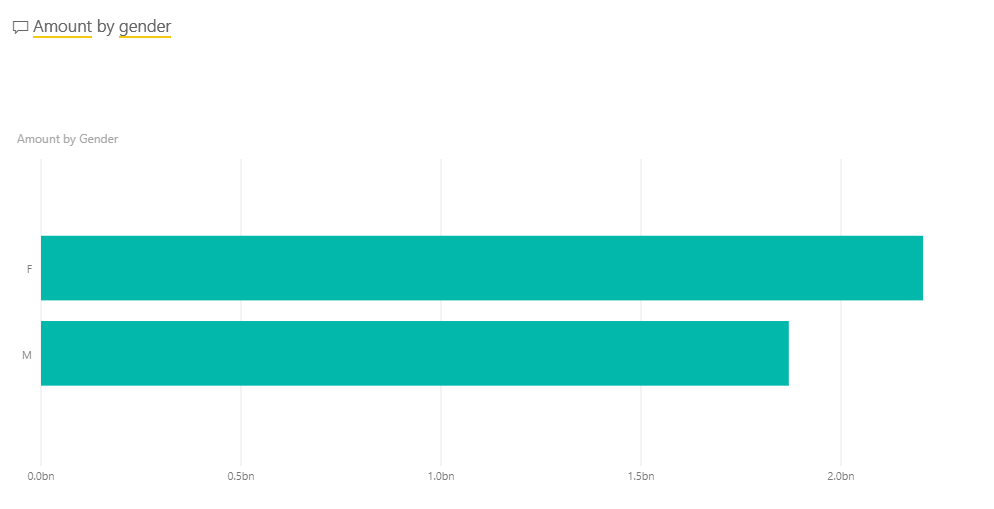
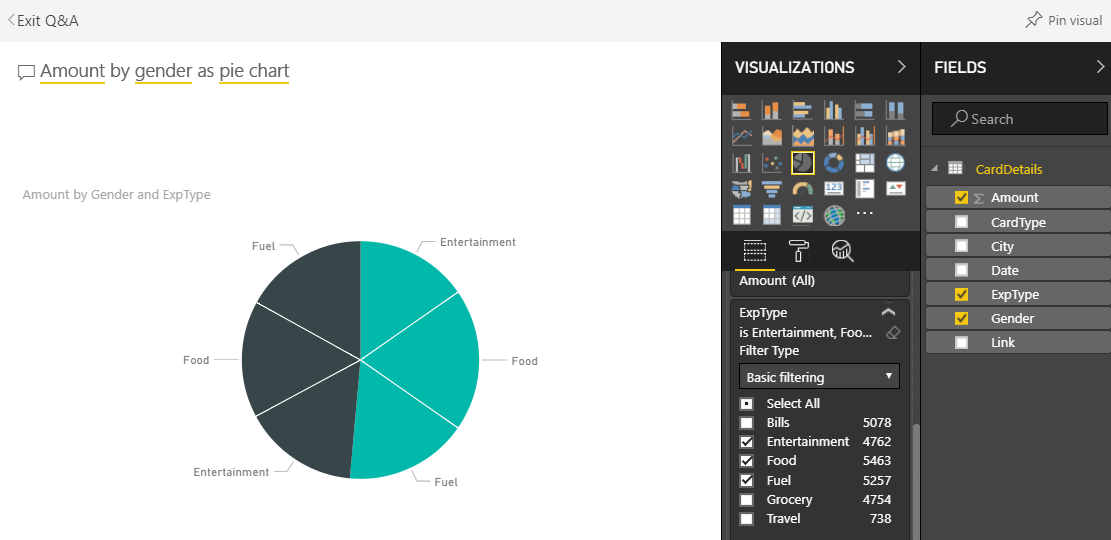
- Dynamically generates a visual depending on the question.
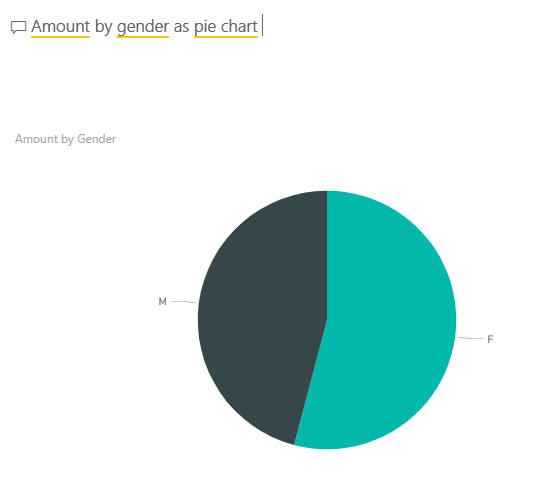
- Can change the visual type using the ‘as’ keyword.
- Can pin this new visualization back to your dashboard.
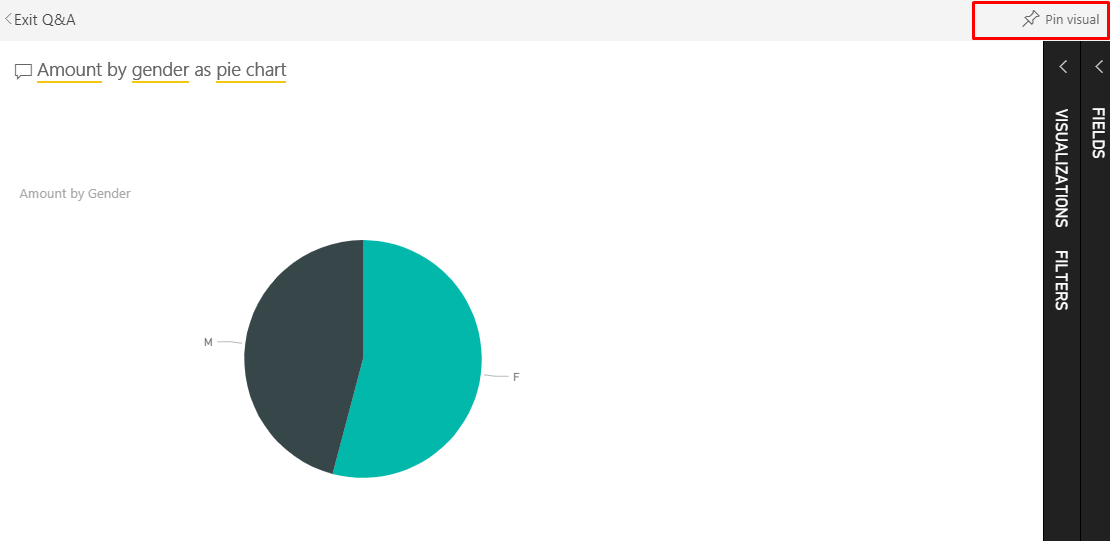
- The visual answers can also be edited. Just by using the Visualizations and the Filter panes on the right side of the screen we can alter the layout, adjust filters and change fields.
Conclusion:
We have discussed the various features that can be used with Q&A which can improve our ability in analyzing data.
