
Summary
Sales managers at an Australian garment and linen laundry provider could see team targets on Dynamics 365 Goal charts, but they could not open the deals behind any figure. We paired each goal with Opportunity charts that share its rollup query filters. Managers now go from a missed target to the specific opportunities on one dashboard.
Each dot on a Goal Progress chart is a field on a single goal record, so a click has nothing to group by. We added three system charts on the Opportunity table beside the Goal charts on the Sales Manager dashboard, with no custom code.
This work builds on our wider Dynamics 365 Sales engagement with the same client. Read the full case study: Transforming Sales Operations for a Leading Australian Linen & Garment Services Provider.
- Industry
- Commercial laundry and linen services
- Region
- Australia
- Users
- Sales managers and their salespeople
- KPIs tracked
- Signed contracts and new contract revenue
Table of Contents
Business Challenges
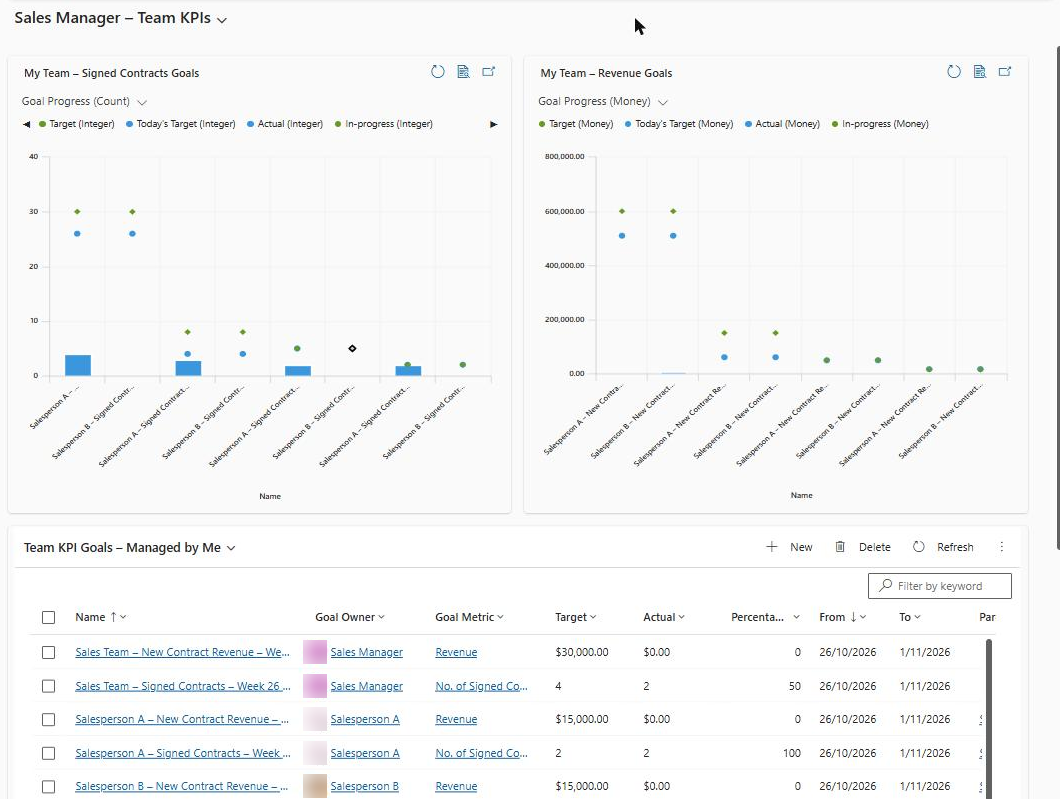
The Sales Manager dashboard told managers how far each salesperson was from target, and then stopped. Each salesperson carried two annual goals, one for signed contracts and one for new contract revenue, and the two Goal Progress charts plotted them well. The trouble started with the follow-up question about which deals sat behind a low Actual.
- A dot that led nowhere. Clicking Target, Actual or In-progress on a Goal chart did not open a single opportunity
- Filters rebuilt by hand. Managers left the dashboard, opened an opportunity view, and set owner and close date range themselves for every salesperson they wanted to check
- Two totals for one question. The hand-built view often disagreed with the goal’s Actual, and nobody could say which one was right
- No way to tell weak sales from bad data. A low Actual could mean few contracts signed, or a signed contract whose opportunity was never closed as Won
- One-to-ones that opened with data gathering. The first part of each coaching session went on assembling the list of deals to talk about
Managers liked the Goal charts and did not want them replaced. The brief was narrow: keep the target view, and add a direct route from it to the opportunity records.
Solution Overview
We rebuilt the Sales Manager dashboard so the Goal charts keep showing progress and a second row of Opportunity charts explains it. Both rows count the same deals, because each Opportunity chart uses the same owner, status and close date rules as the goal it sits beside.
The dashboard now reads top to bottom in the order a manager works through a review.
- Top row, the targets. Goal Progress charts for signed contracts and new contract revenue, one category per salesperson
- Middle row, the deals. Won Opportunities by Owner, Actual Revenue by Owner, and Open Pipeline by Owner and Stage. A manager clicks a salesperson’s bar, regroups it by month, account or sales stage, and opens the records
- Bottom row, the follow-up. The Team KPI Goals grid for opening any goal record, and an open pipeline view for deals that still need action
 1
2
3
- Goal Progress charts show Target, Actual and In-progress for each salesperson
- Opportunity charts with drill-down by owner, month, account and stage
- Team KPI Goals grid and open pipeline view for follow-up
Everything on the page is standard Dynamics 365 Sales configuration. There is no plugin, no JavaScript and no custom control to carry through future releases.
Technical Approach
The design rests on one mechanism: the rollup query that feeds a goal’s Actual is also the filter for the chart that explains it. The rest of this section covers why the Goal chart cannot do the job alone, how we wired the two together, and where the numbers can still drift apart.
Why can’t you drill down on a Dynamics 365 Goal chart?
A Goal Progress chart has nothing underneath a data point to drill into. It is a multi-series chart on the Goal table, where each category on the horizontal axis is one goal record and each dot is a column on that record: Target, Today’s Target, Actual or In-progress.
Drill-down in a model-driven app regroups the rows inside a chart segment by another column. One goal record is one row. The won opportunities that produced the Actual live in a different table, and a system chart cannot drill across tables.
Where does a goal’s Actual figure come from?
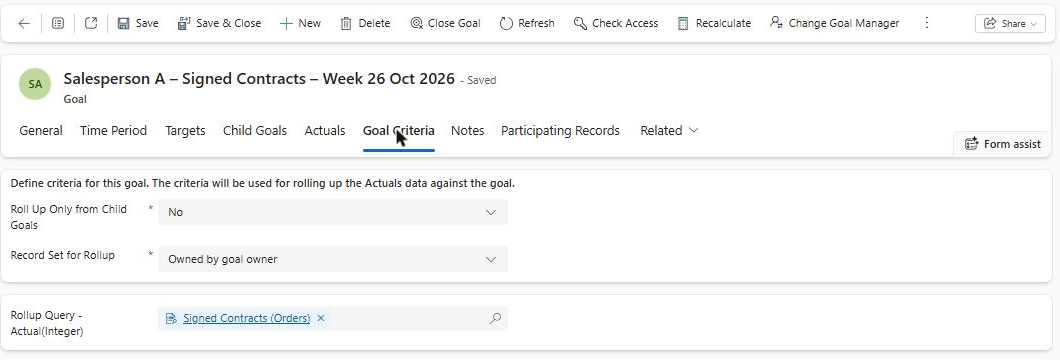
The Actual and In-progress values come from rollup queries attached to the goal, evaluated against the goal owner’s records for the goal period. That makes the rollup query the only reliable definition of which deals count.
- TargetGoal recordOne per salesperson, per KPI, per year
- RuleRollup queryOwner, status and close date in period
- RecordsOpportunity tableWon and open opportunities
- ExplainOpportunity chartSame filter, drill-down enabled
- ReviewSales Manager dashboardTarget and deals on one page
We wrote the rules down once and used them in both places. The table below is the mapping we configured for the two KPIs.
| Goal value | Records counted | Date tested against the goal period | Matching chart |
|---|---|---|---|
| Signed Contracts, Actual (count) | Won opportunities owned by the goal owner | Actual Close Date | Won Opportunities by Owner |
| New Contract Revenue, Actual (money) | Won opportunities owned by the goal owner, summed on Actual Revenue | Actual Close Date | Actual Revenue by Owner |
| In-progress, both KPIs | Open opportunities owned by the goal owner | Est. Close Date | Open Pipeline by Owner and Stage |
Goal values and the Opportunity charts that mirror them, from this project
Build sequence
- Confirm the goal metric and its rollup fieldsFor each metric, check the source table, the status that counts, and the date column used for Actual and for In-progress. These three settings decide everything the charts must copy.
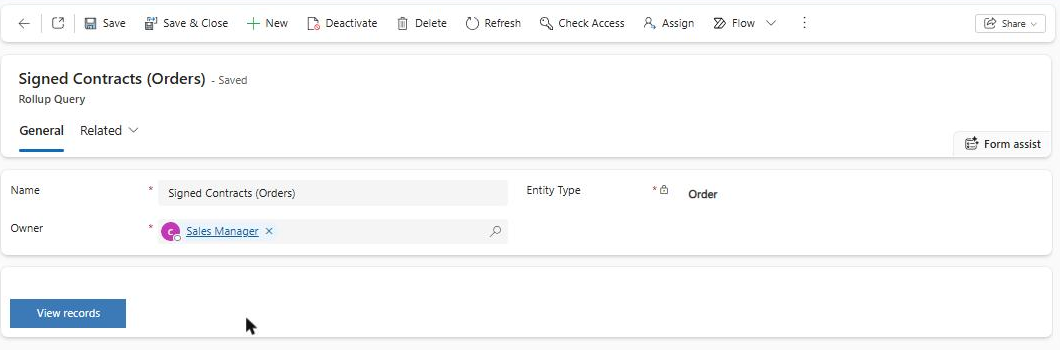
- Attach a rollup query to each rollup fieldIn the goal’s criteria, we set the record set to records owned by the goal owner and attached a rollup query on Opportunity for Actual and another for In-progress.
- Create Opportunity system views with the same conditionsOne view for won opportunities closed in the current year and one for open opportunities due to close in the current year. A dashboard chart is bound to a view, so the view carries the filter.
- Build three single-series system charts on OpportunityCount of opportunities by Owner, sum of Actual Revenue by Owner, and open pipeline by Owner with Sales Stage as the series.
- Add each chart to the dashboard as a chart componentWe placed every chart directly on the dashboard and bound it to its view. Charts inside a subgrid or associated grid do not offer drill-down.
- Reconcile one salesperson before releaseRecalculate that person’s goal, then compare its Actual with their bar on the Won Opportunities chart. Any difference at this point is a filter mismatch, and it is cheaper to find now than in a sales review.
 1
 1
The view behind the Won Opportunities chart is short. Status equals Won, and Actual Close Date falls in the current year, which matches the calendar-year goals the team uses.
<fetch>
  <entity name='opportunity'>
    <attribute name='name' />
    <attribute name='ownerid' />
    <attribute name='actualvalue' />
    <attribute name='actualclosedate' />
    <filter type='and'>
      <condition attribute='statecode' operator='eq' value='1' />
      <condition attribute='actualclosedate' operator='this-year' />
    </filter>
  </entity>
</fetch>
Where the goal and the chart can disagree
Matching filters keep the two rows aligned, with three exceptions worth planning for.
- Refresh timing. Goal rollups run on a schedule, 24 hours by default in System Settings, while the Opportunity charts read live data. A contract signed this morning appears on the chart first. The Recalculate command on the goal record closes the gap on demand
- The wrong date column. A view filtered on Created On will never match a goal that tests Actual Close Date. This is the most likely cause of a persistent mismatch
- Relative date filters. A system view cannot read a goal’s From and To dates. It uses a relative operator such as This Year, so goals with custom periods need their own view, and a fiscal year that differs from the calendar year needs the fiscal operator instead
Options we weighed
We compared four ways to give managers both the target and the deals. The combined dashboard won because it met both needs with configuration the client’s own administrators can maintain.
| Criteria | Goal charts only | Opportunity charts only | Our choiceGoal and Opportunity charts together | Embedded Power BI report |
|---|---|---|---|---|
| Shows progress against target | ✓ | ✗ | ✓ | ✓ |
| Drill-down to opportunity records | ✗ | ✓ | ✓ | ✓ |
| Standard Dynamics 365 configuration only | ✓ | ✓ | ✓ | ✗ |
| Cross-filtering between target and deals | ✗ | ✗ | ✗ | ✓ |
The one gap in the chosen design is cross-filtering. Selecting a salesperson on one system chart does not filter the charts beside it, so a manager drills into each chart separately.
Frequently asked questions
Q1Can you drill down on a Dynamics 365 Goal chart?
No. A Goal Progress chart plots columns from one goal record per category, such as Target, Actual and In-progress, and drill-down in a model-driven app works by regrouping the rows in a segment by another column. A single goal record has no rows to regroup. To reach the deals, open the goal record from the goals grid, or place a chart built on the Opportunity table next to the Goal chart and drill into that.
Q2How often does a goal’s Actual value update?
24 hours is the default interval. Dynamics 365 recalculates goal rollups on a schedule set on the Goals tab in System Settings, and an administrator can change it. A manager who needs a current figure before a review can open the goal and select Recalculate. The Opportunity charts on the same dashboard read live data, so shortly after a deal closes the chart can sit one deal ahead of the goal.
Q3Does drill-down work on a chart inside a subgrid?
No. Charts shown in a subgrid or an associated grid on a form do not offer drill-down. On this project every chart is a chart component placed directly on the Sales Manager dashboard, each bound to the Opportunity table and a specific system view. If a chart on your dashboard will not drill, check how it was added to the page before you look at the chart definition.
Q4Do we need Power BI to connect sales targets to deals?
No. Standard goals, rollup queries, system charts and one dashboard covered both KPIs for this sales team. Power BI becomes the better choice when managers want to select a salesperson once and have the target, the won deals and the open pipeline filter together, because system charts on a dashboard do not cross-filter each other. An embedded Power BI report can sit on the same dashboard when that need appears.
Impact
Managers now answer the question behind a missed target on the same page that shows the target. The figures below describe what we delivered on this project.
- 3Opportunity charts added beside the Goal charts, this project
- 2KPIs covered: signed contracts and new contract revenue
- 1Dashboard for both the target and the deals behind it
- 0Lines of custom code, plugins or scripts
The change shows most clearly in what a manager does after spotting a salesperson behind on signed contracts.
- Click the Actual dot, nothing opens
- Leave the dashboard for an opportunity view
- Set owner and close date range by hand
- Total often differs from the goal’s Actual
- Click the salesperson’s bar on the Opportunity chart
- Regroup by month, account or sales stage
- Open the opportunity records from the chart
- Chart total follows the same rules as the goal
Four effects followed from that shorter path.
- One-to-ones open on deals. The manager arrives with the salesperson’s won and open opportunities already on screen
- Numbers hold up in front of leadership. The goal’s Actual and the chart total come from the same owner, status and date rules, so managers can show the records behind any figure
- Data quality problems surface early. An opportunity left open after the contract was signed now shows up as a gap between the goal and the chart
- New KPIs follow a known recipe. Renewals or customer visits need a goal metric, a rollup query, a view and a chart built to the same rules
Conclusion
The running cost of this design is discipline about filters. Every time the client changes what counts toward a goal, someone has to change the rollup query and the Opportunity view together, or the two rows of the dashboard will drift apart. We documented each pair in a single mapping table for that reason. If the sales team later asks for one click that filters targets, won deals and pipeline at once, that is the point to add an embedded Power BI report to the same dashboard.
Next Step
Can your sales managers open the deals behind a missed target?
Our Dynamics 365 Sales consultants review your goals, rollup queries and dashboards, and show you where a target loses its link to the opportunity records.
Contact CloudFrontsAuthor Profile

Cassandra Rodrigues
Consultant · CloudFronts
Cassandra Rodrigues is a Microsoft Dynamics 365 and Power Platform Consultant with four years of experience delivering CRM customization, business-process automation, customer portals, and system integrations. Her work spans Dynamics 365 Sales, Customer Service, Project Operations, Power Apps, Power Automate, Power Pages, Microsoft Dataverse, JavaScript, C# plugins, and Azure Functions. She focuses on understanding how people work today and translating complex business processes into practical, scalable digital solutions.