

How a Leading North American Commercial Vehicle Manufacturer Optimized Sales Order Posting Using Trace Parser
Summary
- Trace Parser is a Microsoft diagnostic tool that analyzes execution traces captured from Dynamics 365 Finance & Operations (D365 F&O) to help troubleshoot performance issues without traditional debugging.
- It records detailed information on X++ method execution, SQL queries, call stacks, execution time, user sessions, database interactions, and RPC calls.
- Traces are captured directly from the D365 F&O application UI, saved as .aet files, and then opened and analyzed in the Trace Parser desktop application.
- The tool’s Sessions, Call Tree, SQL Statements, and Timeline views make it possible to pinpoint slow forms, long-running SQL queries, and inefficient X++ code.
- A real-world example shows Sales Order posting time reduced from 40 seconds to 8 seconds after identifying and fixing a looped validation method using Trace Parser.
- Following best practices — short, targeted traces and before/after comparisons — makes analysis faster and results more reliable.
Table of Contents
- 01 Summary
- 02 Introduction
- 03 What is Trace Parser?
- 04 Why Use Trace Parser?
- 05 When Should You Use Trace Parser?
- 06 Prerequisites
- 07 Capturing and Opening a Trace
- 08 Understanding the Trace Parser Interface
- 09 Analyzing Performance Issues
- 10 Common Performance Problems
- 11 Best Practices, Limitations & Tips
- 12 Real-World Example
- 13 Conclusion
Introduction
Performance issues and unexpected system behavior can be challenging to troubleshoot in Microsoft Dynamics 365 Finance & Operations (D365 F&O). While debugging X++ code is useful during development, it is often not possible in Sandbox or Production environments. This is where Trace Parser becomes an invaluable diagnostic tool.
Trace Parser captures detailed execution information, allowing developers and support engineers to analyze application performance, identify slow processes, review SQL queries, and understand the execution flow of X++ code.
In this blog, you’ll learn what Trace Parser is, when to use it, how to capture a trace, and how to analyze the results effectively.
What is Trace Parser?
Trace Parser is a Microsoft diagnostic tool used to analyze execution traces generated by D365 Finance & Operations. It records detailed information about:
- X++ method execution
- SQL queries
- Call stacks
- Execution time
- User sessions
- Database interactions
- RPC calls
Unlike traditional debugging, Trace Parser helps analyze issues after they occur by reviewing a captured trace file.
Why Use Trace Parser?
Trace Parser is commonly used to:
- Investigate slow forms and reports
- Identify long-running SQL queries
- Analyze batch job performance
- Detect inefficient X++ code
- Find excessive database calls
- Troubleshoot performance bottlenecks
- Understand application execution flow
When Should You Use Trace Parser?
Consider using Trace Parser in scenarios such as:
- A form takes too long to open.
- A report is running slowly.
- A batch job is consuming excessive time.
- A custom process performs poorly after deployment.
- Users report intermittent performance issues.
- You need to identify the exact SQL query causing delays.
Prerequisites
Before capturing a trace, ensure you have:
- Access to the D365 F&O environment
- Permission to use Trace functionality
- Trace Parser installed (typically on a development VM)
- A reproducible scenario
Capturing and Opening a Trace
1 Step 1
Enable Tracing
In D365 Finance & Operations:
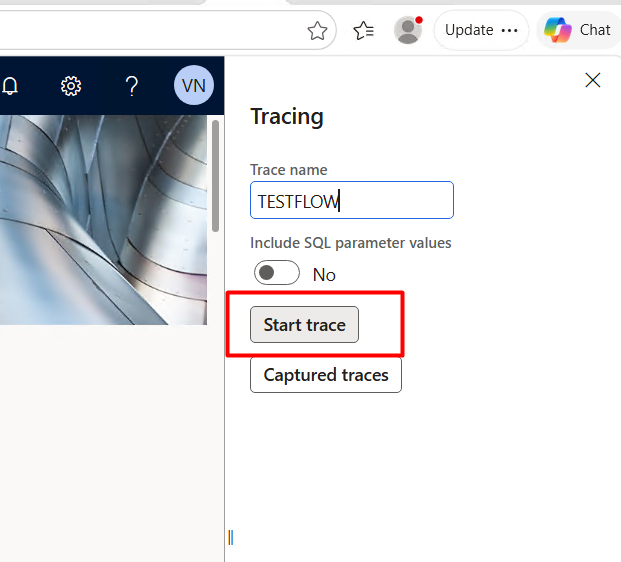
- Sign in to the application.
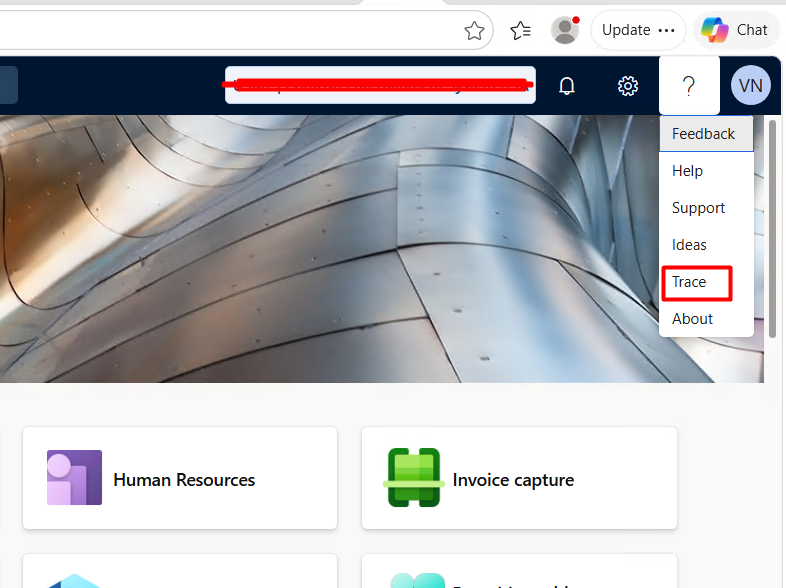
- Click the Question Mark icon.
- Open the Trace tab.
- Click Start Trace.
The system will begin recording user activities.
Tip: Only capture the specific business process you want to analyze. Long traces create large files and are harder to analyze.
2 Step 2
Reproduce the Issue
Perform only the actions related to the issue, for example:
- Open the problematic form
- Run the report
- Execute the batch job
- Perform the slow business process
Avoid unrelated activities during tracing.
3 Step 3
Stop the Trace
Once the scenario is complete:
- Return to the Trace tab.
- Click Stop Trace.
- Save the generated trace file (.aet).
This file contains all recorded execution details.
4 Step 4
Open Trace Parser
Launch the Trace Parser application on your development machine.
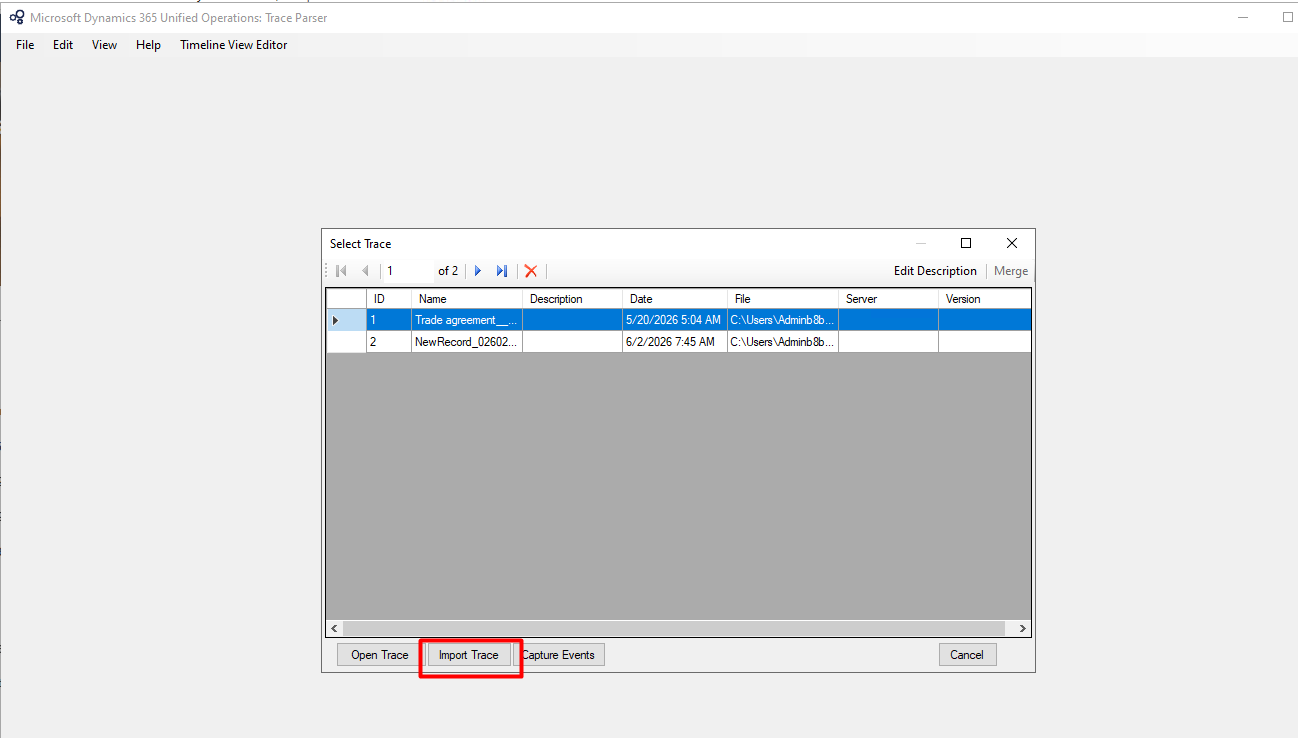
- Go to File → Open Trace.
- Choose the saved .aet file.
- Trace Parser will import and process the trace, which may take a few minutes depending on the file size.
Understanding the Trace Parser Interface
After loading the trace, you’ll see several sections:
Sessions
Displays all captured user sessions. Useful for identifying the correct user, filtering traces, and analyzing specific requests.
Call Tree
Shows the hierarchy of X++ method calls, including which methods were executed, parent-child relationships, and time spent in each method.
SQL Statements
Displays all SQL queries executed during the trace, useful for identifying long-running queries, missing indexes, repeated calls, and excessive SELECTs.
Timeline
Shows the execution flow over time, making it easier to identify performance spikes, waiting periods, and expensive operations.
Analyzing Performance Issues
When reviewing a trace, focus on:
1 Focus Area 1
Long-Running Methods
Sort methods by execution time. Look for:
- High execution duration
- Frequent method calls
- Recursive methods
2 Focus Area 2
SQL Execution Time
Check:
- Query duration
- Number of executions
- Table scans
- Repeated queries
Repeated SQL queries often indicate inefficient code.
3 Focus Area 3
Excessive Database Calls
Example — instead of calling CustTrans::find() inside a while select loop over custTable, consider reducing repeated database calls using joins, caching, or optimized queries.
4 Focus Area 4
Nested Loops
Deep nested loops can significantly impact performance. Optimize by:
- Reducing iterations
- Using set-based operations
- Minimizing database access inside loops
Common Performance Problems Identified by Trace Parser
| # | Issue | Recommendation |
|---|---|---|
| 1 | Repeated SQL queries | Cache data or combine queries |
| 2 | Long-running methods | Optimize business logic |
| 3 | Excessive RecIds lookups | Use joins where appropriate |
| 4 | Full table scans | Review indexes and filtering |
| 5 | Nested loops | Refactor using set-based operations |
| 6 | Slow report execution | Optimize queries and data providers |
Best Practices, Limitations & Tips
Best Practices
- Capture only the required scenario.
- Keep traces short.
- Test in a Sandbox or development environment whenever possible.
- Compare traces before and after code changes.
- Archive traces for future reference.
- Avoid tracing during peak business hours unless necessary.
Limitations
Trace Parser is a powerful tool, but it has some limitations:
- Large trace files require more time to process.
- Long traces are difficult to analyze.
- It identifies performance symptoms but doesn’t automatically suggest fixes.
- Production tracing should be performed carefully to minimize system impact.
Tips for Effective Analysis
- Start with the longest-running methods.
- Review SQL execution times.
- Compare multiple traces to identify improvements.
- Focus on custom code before standard Microsoft code.
- Look for repetitive patterns rather than isolated events.
Real-World Example
Scenario: Users report that posting a Sales Order takes over 40 seconds.
Using Trace Parser:
- Capture a trace while posting the Sales Order.
- Open the trace in Trace Parser.
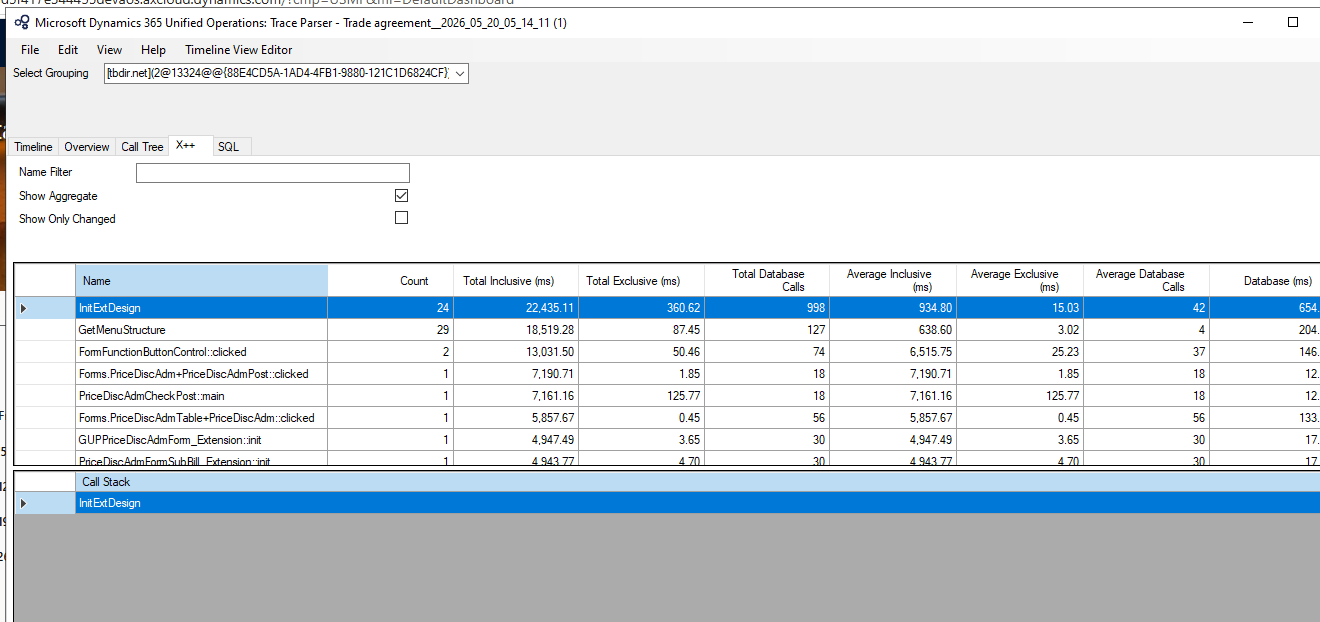
- Review the Call Tree and identify methods with the highest execution time.
- Inspect SQL Statements for slow or repeated queries.
- Discover that a custom validation method executes inside a loop, causing hundreds of unnecessary database calls.
- Refactor the code to perform a single optimized query outside the loop.
- Capture a new trace and compare the results.
Outcome: Sales Order posting time is reduced from 40 seconds to 8 seconds.
Conclusion
Trace Parser is one of the most valuable diagnostic tools for Microsoft Dynamics 365 Finance & Operations developers and support teams. It provides deep visibility into application execution, helping identify performance bottlenecks, inefficient SQL queries, and expensive X++ methods that are difficult to detect through standard debugging.
By learning how to capture, interpret, and analyze traces effectively, developers can optimize customizations, improve application performance, and deliver a better user experience. Whether you’re troubleshooting a slow report, investigating a batch job, or optimizing custom business logic, Trace Parser should be an essential part of your D365 F&O performance tuning toolkit.