Bridging the Gap: How Sales Reporting Aligns Teams with Business Objectives
In today’s fast-paced business landscape, alignment between sales teams and overall business objectives is crucial for success. However, many organizations struggle with fragmented communication, misaligned goals, and inefficient decision-making. This is where sales reporting plays a transformative role. By leveraging accurate and real-time data, businesses can ensure that every department—from sales to marketing to finance—is working towards a unified vision.
The Importance of Sales Reporting in Business Alignment
Sales reporting is more than just tracking revenue—it’s a strategic tool that helps businesses:
- Define Clear Goals – Sales reports provide tangible insights into performance metrics, allowing teams to set realistic and achievable goals.
- Improve Decision-Making – With access to comprehensive data, leaders can make informed decisions that align with company-wide objectives.
- Enhance Team Collaboration – Sales reports create transparency and foster communication between different departments.
- Boost Productivity – By identifying trends and inefficiencies, teams can optimize their efforts and work more efficiently.
How Sales Reporting Aligns Teams
1. Data-Driven Goal Setting
Sales reporting provides clear benchmarks for teams to measure performance. By using historical data, businesses can set realistic sales targets that align with revenue goals, ensuring that every department contributes to overall growth.
2. Transparency and Accountability
When all departments have access to sales performance metrics, it promotes accountability. For example, if a sales team struggles with conversions, marketing can adjust its lead generation strategies accordingly. This ensures that teams are not working in silos but rather as a cohesive unit.
3. Optimizing Sales Strategies
Regular sales reports highlight which products or services are performing well and which need improvement. Sales managers can use these insights to refine sales pitches, adjust pricing strategies, or reallocate resources to high-performing areas.
4. Customer Insights for Better Engagement
Sales reports provide valuable data on customer behavior, preferences, and buying patterns. This enables teams to personalize their approach, leading to higher customer satisfaction and increased retention rates.
For example: A mid-sized SaaS company struggling with declining sales implemented real-time sales dashboards to track performance across multiple teams. By analyzing the data, they:
- Identified their most profitable customer segment.
- Adjusted their sales strategies to focus on high-value leads.
- Enhanced communication between marketing and sales teams. Within six months, the company saw a 20% increase in revenue and a 15% improvement in customer retention.
Example 1: CRM Dashboard for Sales Performance Analysis
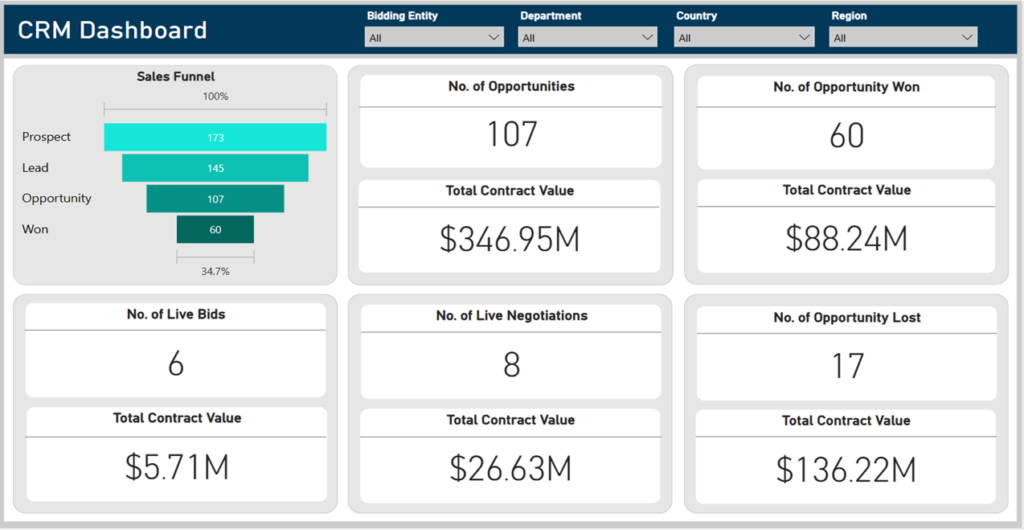
A CRM Dashboard, like the one shown below, helps businesses track critical sales metrics:
- Sales Funnel: Displays the number of prospects (173), leads (145), opportunities (107), and deals won (60), providing a clear view of the sales conversion process.
- Opportunities Won & Lost: Tracks the number of deals won (60) and lost (17), helping teams analyze success rates and refine their approach.
- Contract Value Metrics: The total contract value of opportunities ($346.95M) vs. won deals ($88.24M) gives insights into revenue generation.
- Live Bids & Negotiations: Monitoring live bids (6) and negotiations (8) with corresponding contract values enables better sales forecasting and strategic planning.
By leveraging such dashboards, companies can make data-driven decisions, enhance collaboration, and ultimately align sales efforts with overarching business goals.
Example 2: Sales and Brand Performance Dashboard
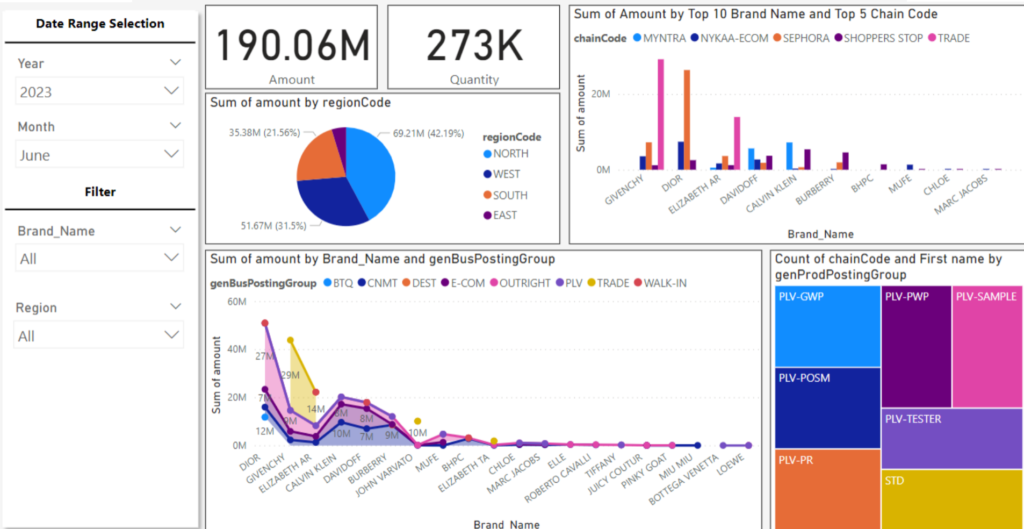
Another example of effective sales reporting is a Sales and Brand Performance Dashboard, which provides:
- Total Sales Amount ($190.06M) and Quantity Sold (273K): A high-level overview of sales performance for a given period.
- Regional Sales Distribution: A breakdown of sales performance across different regions (North, West, South, East), helping businesses identify strong and weak markets.
- Brand & Chain Code Performance: Insights into sales trends by top brands and distribution channels (e.g., Myntra, Sephora, Nykaa-Ecom, Shoppers Stop, Trade).
- Category and Product Group Analysis: Sales trends by posting groups and product categories help refine marketing strategies and product offerings.
This level of visibility ensures that sales, marketing, and finance teams are working towards common business objectives, optimizing resources, and increasing profitability.
To Conclude, sales reporting is not just about numbers—it’s about aligning teams with business goals to drive success. If your business is looking to improve sales performance, start by implementing data-driven reporting tools to enhance collaboration, optimize strategies, and achieve long-term growth.
Want to learn more about how sales reporting can transform your business? Get in touch with us today for consultation!
We hope you found this blog useful, and if you would like to discuss anything, you can reach out to us at transform@cloudfonts.com.
