

How CloudFronts Built a Project Risk Assessment Engine with Databricks Genie
Summary
On most delivery projects, the warning signs appear well before the escalation. They sit in email threads, support case notes, overdue invoice reminders, and resource utilization reports – scattered across systems that nobody has the time to cross-reference every week. By the time a project gets formally marked at risk, it is usually already a difficult conversation.
This post shares what we built at CloudFronts to solve that problem from the inside. The Project Risk Engine uses a multi-model AI approach running on Azure Databricks to read unstructured project communication, score project health, and flag projects in RED – all surfaced to project managers inside Microsoft Teams through Databricks Genie, in plain English. We built it for our own PMO first. This article walks through why we built it, how it works, and what it changed.
Table of Contents
Where This Started
This did not start as a product idea. It started as a recurring frustration inside our own team – the group at CloudFronts responsible for delivery and billing excellence.
Three things kept happening. Early warning signs were buried in long email chains, so risks only surfaced after they had grown. Project managers had no quick way to assess project health, which meant the team reviewed each project by hand every week just to work out where things stood. And because we run many projects simultaneously, it was easy for a real problem to slip through unnoticed.
Here is a real example. One of our clients had a support agreement coming up for renewal. It is the kind of thing everyone assumes someone else is tracking – but it was not flagged until almost the last day. If that client had decided not to renew, leadership would have had no early warning at all. The information was there. It just was not in front of anyone in time.
In another case, a project had two phases and the client had not yet confirmed the scope for the second. That was a clear risk to the final payment. Most of us were aware of it in some abstract way – but the project was not formally flagged until the invoice was already due. A few weeks earlier would have made a real difference.
“The warning signs were already there. They were just scattered, and easy to miss until it was too late.”
Where Project Health Actually Lives
A project’s health is not in one place. It is spread across four areas – and any one of them, left unmonitored, can become a risk that affects cash flow, client relationships, or delivery quality.
Booking
Contract renewals, new work coming in, and MSA status. A contract quietly approaching expiry is a risk most teams only notice when it is almost too late.
Billing & Delivery
Project status, open risks, support tickets, internal notes, and the client emails tied to them. This is where the unstructured signals sit.
Collection
What has been invoiced, what is outstanding, and what is running overdue. Delayed invoicing and unpaid milestones are early indicators of a project in trouble.
Resource & Utilization
Who is working on what, how busy they are, and where allocation gaps are forming. Low utilization on a contracted engagement is a billing risk waiting to happen.
Any one of these on its own does not tell you much. You only see the full picture when you put all four together – and that is exactly what the engine does.
What the Project Risk Engine Does
1Unifies the data – Delivery, support, billing, and resourcing data from Dynamics 365 CRM and Outlook is pulled into one governed dataset on Azure Databricks, structured through a Medallion Architecture (Bronze → Silver → Gold).
2Reads the unstructured signals – AI reviews client emails, internal notes, and case history to surface hidden threats: delays, blockers, escalation patterns, and unanswered client requests that never make it into a status field.
3Scores and flags – Every project receives a health score from zero to ten, along with a risk summary, identified threats, and next recommended actions. Projects meeting RED criteria are automatically flagged.
4Makes it conversational – Project managers can ask questions about any project in plain English, directly inside Microsoft Teams through Databricks Genie. No dashboards to open, no reports to pull.
How It Works – A Multi-Model, Four-Layer Approach
The risk analysis is not a single AI call. It is a deliberate, layered process – lightweight checks first, heavy AI only where it is needed. This keeps it fast and cost-efficient while ensuring accuracy on the things that matter.
Solution Architecture
Here is how the full architecture fits together – from data sources through to the project manager asking a question in Teams.
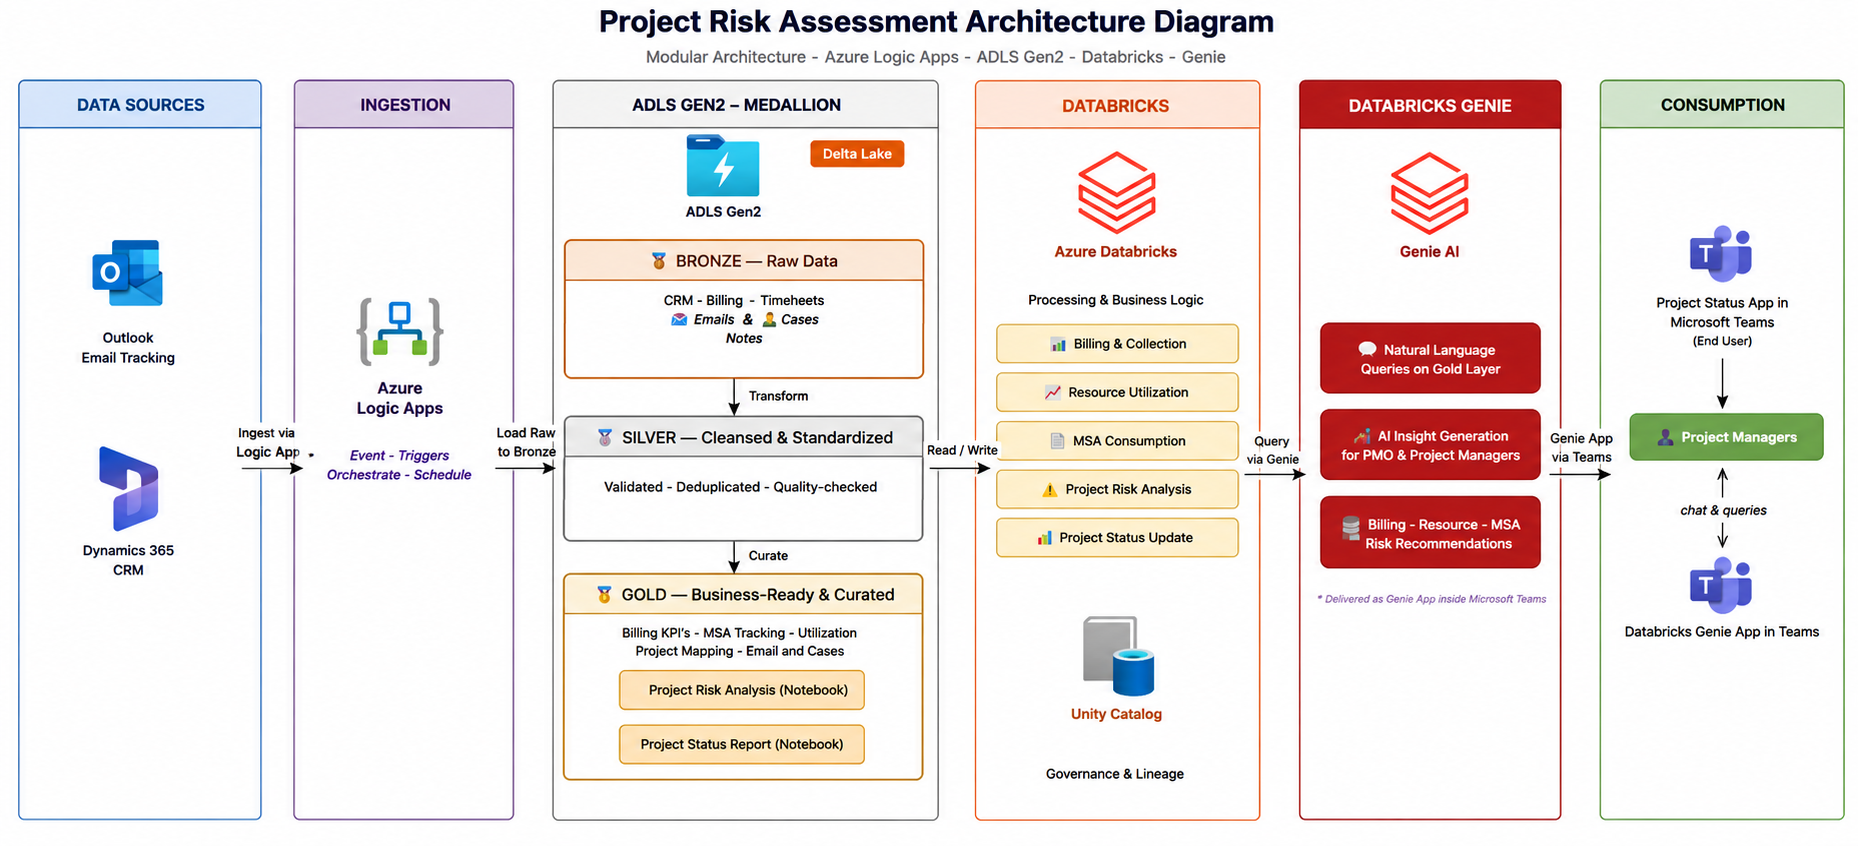
Data flows from Dynamics 365 CRM and Outlook → Azure Logic Apps → ADLS Gen2 Medallion layers → Azure Databricks → Genie AI → Microsoft Teams
How a Project Gets Flagged RED
A project in RED requires immediate PMO attention. RED status is determined by four clear, rule-based parameters – not by a person’s judgment. Any single one is sufficient to trigger the flag.
Low AI Health Score
The project’s AI-generated health score drops to 5 or below based on risk analysis from email and case communication.
Overdue Invoice
Any invoice on the project is overdue by more than 21 days, indicating a collection risk that needs active follow-up.
MSA Renewal Approaching
The Master Service Agreement is due for renewal within the next 30 days – easy to miss until it is already urgent.
Low Monthly Utilization
Resource consumption has fallen below 50% in the most recent month, indicating an engagement at risk of under-delivery.
Genie in Teams – What It Looks Like in Practice
The output of the Risk Engine is surfaced through Databricks Genie, embedded directly inside Microsoft Teams. Project managers type a question in plain English and get an answer – no tool switching, no separate login.
Genie also works outside its own space. In any existing Teams chat – say, a conversation already happening with a delivery lead or a colleague – a team member can type @Databricks Genie followed by their question, and Genie responds right there in that conversation. No need to open the Genie app or start a new thread.
For example, in a chat with a colleague, a project manager asked: “Show me the invoice details related to the project GA – CSP MSA.” Genie responded in the same chat with the full invoice breakdown – amounts, due dates, and whether each invoice was paid or outstanding. The question did not need to leave the conversation it was already part of.
Four Genie Spaces cover the main areas the team needs. Here are the kinds of questions team members are actually asking:
Project Status
“Which projects are currently in RED?”
“Give me a full briefing on Project X – status and risks.”
Booking & Collection
“What milestones are due this month?”
“Which invoices are overdue?”
Resource Time Tracking
“Who is over-allocated in the next two weeks?”
“What is the utilization for the D365 team this month?”
Case Tracking
“Show me overdue or stalled cases.”
“Read the full history of a case – notes and emails.”
Genie also supports a tagging feature – team members can tag @Databricks Genie in any existing Teams conversation and ask a question in context. The answer comes back in the same thread without leaving the chat. This makes it a natural part of how the team already communicates.
Asking Genie Inside Teams
Here is what it looks like when a project manager asks Genie – right inside Microsoft Teams – to show all projects currently in RED. Genie returns all flagged projects with the specific reason each one was flagged, the risks identified from email and case analysis, and the recommended next actions.
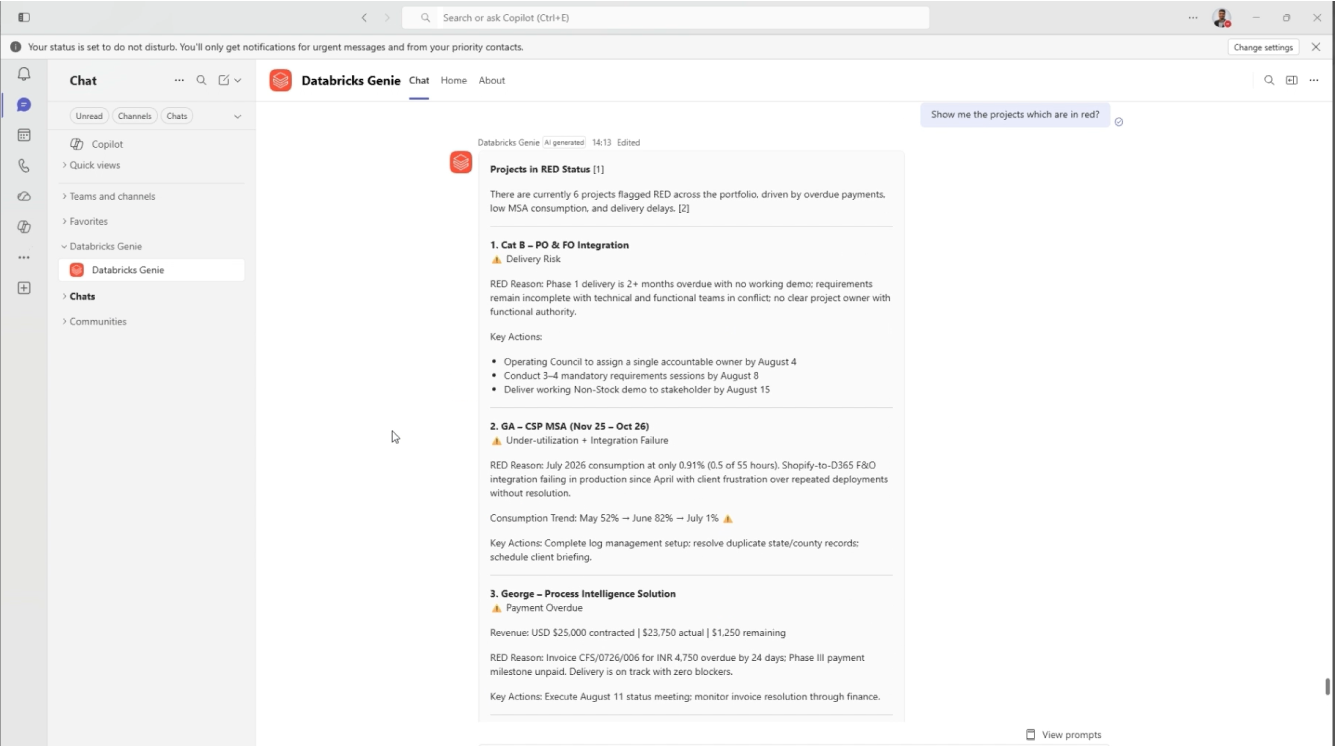
Databricks Genie inside Microsoft Teams – 6 projects flagged RED, each with its risk reason and recommended actions
Drilling Into a Specific Project
From the RED list, a project manager can go a level deeper – asking for invoice details, resource utilization, or a full project briefing. Here, Genie is asked to show invoice details for GA – CSP MSA and responds with milestone invoices, outstanding balances, due dates, and payment status – all in one answer.
Worth noting: Genie is not limited to Microsoft Teams. If your organization uses Claude, Genie can be connected and used directly inside Claude as well – the same questions return the same answers, in whichever AI tool your team already works in.
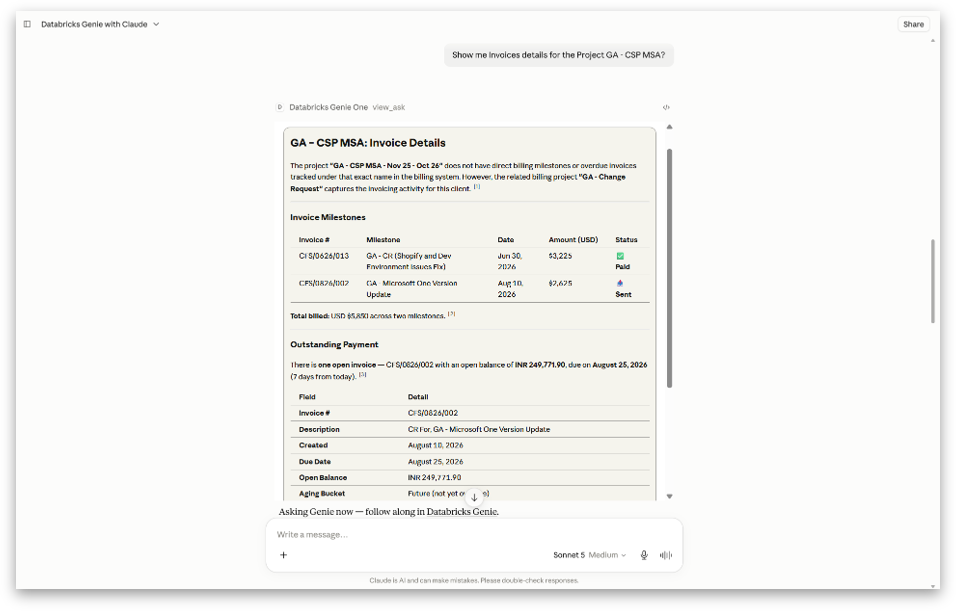
Databricks Genie running inside Claude – the same invoice detail and project insight, available outside of Teams too
Available on Mobile Too
The same answers are available on mobile. A project manager does not need to be at a desk to check on a project – they can pull up invoice details, resource breakdowns, or risk summaries from their phone, in plain English.
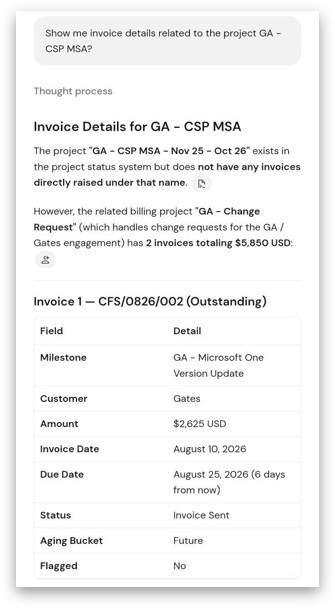
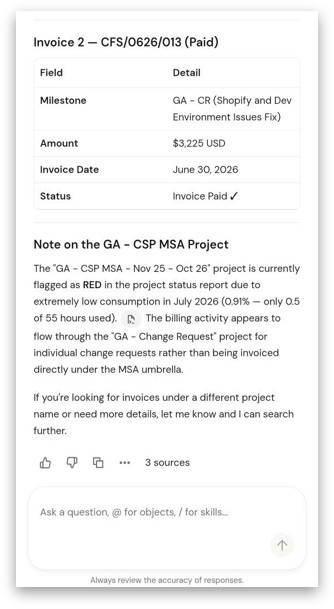
The same invoice and risk detail – available on mobile, in plain English, without opening any separate tool
What Changed for the Team
Who It Helps
The same source of truth answers each team’s own question – without requiring different people to maintain different reports.
CEO
Portfolio health and what is RED, in one view – without needing to ask anyone.
Delivery Leads
Early warning on their projects before a risk becomes a difficult conversation.
Project Managers
The risk picture without the manual digging across reports and systems.
Finance
Milestones due and overdue invoices in one view, updated automatically.
Support Leads
Case status across projects without opening each case individually.
PMO
Full portfolio coverage on consistent, rule-based criteria – every week.
How Other Organizations Can Implement This
What You Need Before Starting
Three things need to be in place before this is worth building:
1
D365 Project Operations (or equivalent CRM) with clean data across projects, invoices, timesheets, and cases. The engine reads from what is already there – if the data is incomplete or inconsistently maintained, the output will reflect that.
2
Outlook for client email communication – the engine reads email threads from Outlook separately from D365. Cases and tickets come from D365, emails come from Outlook. Both are required – D365 gives you the structured case and ticket data, Outlook gives you the unstructured client communication. If either is missing or incomplete, the risk analysis will reflect that gap.
3
Azure Databricks with a Lakehouse, or willingness to set one up. The data pipeline, Medallion transformation, and Genie Spaces all run on Databricks.
Four Steps to Get It Running
A Note on the RED Thresholds
The thresholds CloudFronts uses – health score at or below 5, invoice overdue by more than 21 days, MSA renewal within 30 days, utilization below 50% – were set based on our own delivery patterns and contract types. They are not universal.
A company running large fixed-fee projects might flag an invoice at 14 days. A smaller consultancy running month-to-month retainers might set the MSA window at 60 days. The thresholds are configurable. What matters is that they are agreed across the team and applied consistently – not left to individual judgment on any given week.
Challenges We Faced — and Are Still Working Through
Frequently Asked Questions
Conclusion
Project risk is not a data problem. Most organizations already have the signals – in their CRM, their email threads, their billing records, their support cases. The problem is that nobody has the time to read all of it, every week, across every project, and connect the dots before something becomes urgent.
What the Project Risk Engine does is make that possible. It reads the signals automatically, filters out the noise, applies consistent criteria, and puts the answer in front of the right person – in plain English, inside the tool they already use every day.
We built it to solve our own problem first. It is now part of how we run delivery at CloudFronts. If the problem sounds familiar, the approach is straightforward to replicate – the data is likely already there.
Watch the Webinar
If you want to see the Project Risk Engine in action, we ran a live session walking through the full build – how the data flows from D365 into Databricks, how the four-layer risk analysis works, and how project managers are asking questions in Teams today. The recording covers everything in this article, with a live demonstration.
Watch the Full RecordingWant to Catch Project Risk Earlier?
Most project risks do not appear without warning. The signals are there – in emails, invoices, case notes, and utilization data. If your team is still finding out about problems after they escalate, we can help you think through what it would take to surface them earlier.
Connect with Us →About the Author

Abhishek Kumar
Project Manager · CloudFronts
Abhishek has been with CloudFronts for over 10 years, managing CRM, ERP, and Data projects. He leads Billing and Delivery Excellence at CloudFronts and works with the problem this article describes every day.
Specialization: Dynamics 365, Project Delivery, Billing Excellence, CRM & ERP Implementations.
About the Author

Mihir Hatankar
Data AI Engineer · CloudFronts
Mihir is a Certified Databricks Data Engineer at CloudFronts with 4.5+ years of experience in cloud, data, and AI solutions. He built the Project Risk Engine and specializes in Azure Integration Services, Databricks, and Power BI.
Specialization: Databricks, Azure Integration Services, Power BI, Data Engineering, AI & GenAI.