

Summary
The sales team at commercial laundry and linen rental organization could open any record in Dynamics 365 and still could not answer how much of the open book sat in healthcare. Sector was never a field on a deal, it was four boolean flags on the product, three joins away from the quote a manager wanted to group. We replaced the standard sales dashboards with Custom Sales Dashboard that reads the Dataverse Web API directly, rolls sector up through the line items, and puts leads, opportunities, quotes and signed contracts under a single set of filters. Every tile, cell and chart segment opens the records behind it and exports to Excel with real numbers and real dates.
Table of Contents
Business Challenges
Commercial laundry and linen rental organization runs multiple laundries, called plants in the CRM, and quotes work by the weight a customer sends each week. A deal is a weekly tonnage and a weekly dollar figure before it is anything else, which is why the standard sales charts had so little to say about it.
The reporting asks were ordinary. The data model underneath them was not, and every ask broke on a different part of it.
- Sector is not stored on the lead, opportunity, quote or order. It is independent flags on the product record:
healthcare,motel,garments, etc. A chart grouped on the quote has no column to group by - A single product can carry more than one flag, so one quote can legitimately belong to two sectors. Grouping without a rule double counts the same dollars
- Total Amount reads 0.00 on every quote and every order in the org. All money sits in
annualrevenueandweeklyrevenue, which the standard sales charts and rollups do not read - Contracts are
salesorderrecords. The out of the boxcontracttable is empty, so anything pointed at it returns nothing at all - The plant lookup
laundryis populated on roughly six quotes in ten. The rest only know their laundry through the originating opportunity - Orders copied from an accepted quote frequently carry no line items of their own, so a product level report built on order lines quietly loses them
- Managers wanted one choice of sector, sales person or plant to move leads, opportunities, quotes and contracts together. Standard dashboards filter each chart against its own entity
- Nobody could see the forward book: which signed contracts start in the next twenty weeks, and what weekly tonnage each start week brings
Solution Overview
We built one page that lives inside the CRM as a web resource. It opens like any other dashboard, signs the user in with the session they already have, and reads live records rather than a nightly copy.
The page carries six tabs. Overview holds a pipeline matrix and the stage, sector, sales person and plant mix. Pipeline Activity plots leads and quotes created per week for the last fifteen weeks. Contracts Won shows the forward book by contract start week. Win and Loss compares closed won against closed lost by value and by count. Approvals and Activities measures how long contract, logistics and freight rate decisions take. Reports lists contracted and quoted stock at product line level.
- Three filters at the top, sector, sales person and plant, drive every chart, tile and table on every tab at once
- A fourth filter, customer, appears only on the Reports tab because it only narrows those two tables
- Clicking any chart segment, matrix cell or tile opens a drawer listing the records behind that exact number
- Each row in the drawer links to the real CRM form, and the whole selection exports to Excel with numbers as numbers and dates as dates
Technical Approach
Where the page runs
The dashboard is a single HTML web resource, customDashboard, shipped in the main solution. Running inside the model driven app means it inherits the user’s authentication and their record level security, so a sales person sees their own scope without us writing a line of security code. It resolves the org URL from parent.Xrm.Utility.getGlobalContext() and falls back to window.location.origin when it is opened outside a form, which is what makes local debugging possible.
- SourceDataverse Web API v9.2Live reads with the signed in user’s context
- Load14 parallel queriesOne Promise.all on page open
- IndexLookup maps and sector indexProduct flags resolved once, then cached
- RenderMatrix, tiles and Chart.jsRedrawn in memory on every filter change
- ActDrawer and XLSX exportRecords behind the number, typed for Excel
Everything loads once. Accounts, factories, depots, leads, opportunities, quotes, orders, the three line item tables, products, freight rates, delivery point risk assessments and activities all come down in a single Promise.all, and every later interaction is a filter over arrays already in memory. Changing a filter costs nothing on the network.
Rolling sector up from the product
The rollup walks the line items of a quote, order or opportunity, reads the flags off each product, and weights each sector by line weight times quantity. The heaviest sector becomes the primary, which is what the breakdown charts group on so the totals stay additive. The full list is kept separately and is what the sector filter tests against, so a quote that touches healthcare and motel appears under both filters and is counted once in the donut.
function rollupSectors(lines, productIdField) {
  const weight = {};
  lines.forEach(l => {
    const sectors = PRODUCT_SECTORS[String(l[productIdField] || '').toLowerCase()] || [];
    if (!sectors.length) return;
    const w = (l.cf_weight || 0) * (l.quantity || 1) || (l.quantity || 1);
    sectors.forEach(s => { weight[s] = (weight[s] || 0) + w; });
  });
  const list = Object.keys(weight);
  if (!list.length) return { list: [], primary: 'Not set' };
  const primary = list.reduce((a, b) => (weight[b] > weight[a] ? b : a), list[0]);
  return { list, primary };
}

// An order copied from an accepted quote often has no lines of its own.
// Read through to the quote rather than reporting the contract as unsectored.
function sectorsOfOrder(o) {
  let r = rollupSectors(orderLinesOf(o), '_productid_value');
  if (!r.list.length && o._quoteid_value) {
    const q = LOOKUP.quote[o._quoteid_value.toLowerCase()];
    if (q) r = sectorsOfQuote(q);
  }
  return r;
}
Leads have no line items, so they resolve sector from the customertype option set instead. The five options map onto four sectors, with both healthcare options folding into one. Leads also hold no plant, so the plant filter is told to skip the Open Leads column rather than emptying it.
One filter set across four entities
Each record type resolves to the same three dimensions, sector, owner and plant, and then a single passes() function decides what survives the filter. That is the whole reason one dropdown can move a lead chart and a contract chart together. The quote resolver carries the fallback for the missing laundry lookup.
function dimsOfQuote(q) {
  // laundry is populated on roughly 60% of quotes.
  // Fall back to the laundry on the originating opportunity.
  let plantId = q._laundry_value;
  if (!plantId && q._opportunityid_value) {
    const opp = LOOKUP.opportunity[q._opportunityid_value.toLowerCase()];
    if (opp) plantId = opp._supplier_value;
  }
  const s = sectorsOfQuote(q);
  return {
    sector: s.primary,      // used for grouping
    sectors: s.list,        // used for filtering
    owner: ownerName(q._ownerid_value),
    plant: plantName(plantId)
  };
}

function passes(dims, opts) {
  if (FILTERS.sector !== 'all' && dims.sectors.indexOf(FILTERS.sector) === -1) return false;
  if (FILTERS.owner !== 'all' && dims.owner !== FILTERS.owner) return false;
  if (FILTERS.plant !== 'all' && !(opts && opts.ignorePlant) && dims.plant !== FILTERS.plant) return false;
  return true;
}
Two date questions, two dates
We got this wrong first time. The original build counted a won contract by its contract start date everywhere, which made the forward book correct and made the month and financial year figures useless, because a contract signed in May that starts in August counted in neither period. We split it. The KPI matrix and the sales person bars count a win on the date the order was raised, since an order only exists once a quote has been accepted. The forward book charts still count by the date service begins.
// Signed: an order is only raised once the quote is accepted,
// so creation is the signing event.
function orderSignedDate(o) { return o.createdon; }

// Started: when the linen actually begins moving.
function orderStartDate(o) {
  const q = orderQuote(o);
  return o.contractstartdate || (q ? q.contractstartdate : null);
}Making every number clickable
Charts, matrix cells and tiles all register the records behind them at render time, so the click handler never has to recompute anything or guess which filter produced the figure.
- Register on renderEach chart writes a resolver into DRILL keyed by its canvas id, and each tile or matrix cell writes a function into TILE_DRILL keyed by a data-drill attribute.
- Resolve the clickChart.js hands back the dataset index and the point index. The resolver returns a spec of title, subtitle, entity and the array of records, or several labelled groups where one segment spans quotes and contracts.
- Render the drawerDRILL_COLUMNS holds a column definition per entity, so a lead drawer shows estimated turnover and kilos per week while a contract drawer shows annualised value, start date and approval status.
- Link back to the recordInside the app the row calls Xrm.Navigation.openForm. Outside it, the link falls back to a main.aspx URL in a new tab, which keeps the page usable in a browser tab during testing.
- Export typedEach column carries an optional numeric or date accessor plus an Excel format string, so the workbook gets 31284 formatted as currency rather than the string "$31,284", and a column that can be summed.
The export writes one worksheet per group, sets column widths from the widest cell, freezes the header row and adds an autofilter. Sheet names are sanitised to 31 characters with the illegal characters stripped, because an en dash in a filter label was enough to make Excel refuse the file.
Why not the alternatives
| Criteria | OOB dashboards and charts | Power BI embedded | Our choiceHTML web resource |
|---|---|---|---|
| Groups by a value computed from grandchild rows | ✗ | ✓ | ✓ |
| One filter set across leads, opportunities, quotes and contracts | ✗ | ✓ | ✓ |
| Reads live data with the user’s own security | ✓ | partial | ✓ |
| Opens the CRM record form from a chart | ✓ | partial | ✓ |
| No extra licence, gateway or refresh schedule | ✓ | ✗ | ✓ |
| Change a definition without a deployment | partial | ✓ | ✗ |
| Ongoing owner | Admin | BI team | Developer |
Power BI would have handled the rollup comfortably and is the better answer once the row counts grow. We chose the web resource because the requirement was live records with click through into the form, inside the app the sales team already had open, without adding a refresh schedule to the operations they run.
The weighting is configuration, not opinion
| Stage | Weight | Where the weight comes from |
|---|---|---|
| Opportunity | Own probability, 20% default | closeprobability, falling back to cf_chanceofwinning, then CONFIG.weighting.opportunity |
| Quote | 50% | Flat rate in CONFIG.weighting.quote |
| Contract, open | 90% | Flat rate in CONFIG.weighting.contract |
| Contract, signed | 100% | Counted at full annualised value |
All four values sit in one CONFIG object at the top of the file so the sales director can change the model without touching the rendering code.
What it costs to run, and where it breaks
Writing the aggregation yourself means owning the failure modes yourself. Four are worth naming before anyone copies this pattern.
- The 5000 row ceiling. Every query asks for 5000 rows and no paging is implemented. Quote lines and order lines grow fastest, and when they cross that boundary the page will under-report quietly rather than error. Following
@odata.nextLinkis the first change on the second build - Full payload on every refresh. The Refresh button re-runs all fourteen queries. It is acceptable at the current volumes and it is the wrong shape long term, because date bounded slices belong on the server
- CDN dependency. Chart.js and SheetJS load from jsDelivr. The export degrades to CSV when SheetJS is missing, but the charts have no fallback, so a tenant that blocks external scripts gets an empty page. Hosting both libraries as web resources in the solution removes that risk
- Approval turnaround is a proxy. Days to decision is measured from
createdontomodifiedon, so any edit made after the approval inflates the figure. A dedicated decision date field would make the number exact
Q1Does the dashboard bypass Dynamics 365 security?
No. Every call goes through the Web API using the browser session the user already holds, so record level and field level security apply exactly as they do on a view. A sales person who cannot open a quote will not see it counted in a tile.
Q2What happens when a product has no sector flags set?
The deal is grouped under "Not set" rather than dropped, and "Not set" appears in the sector picker with its own count. Hiding unflagged products would have made the totals disagree with the pipeline figures the team already trusted.
Q3How is the financial year handled?
It is one config value, fyStartMonth, set to July. Financial year to date runs from 1 July to today, which matches the 30 June year end reports against.
Impact
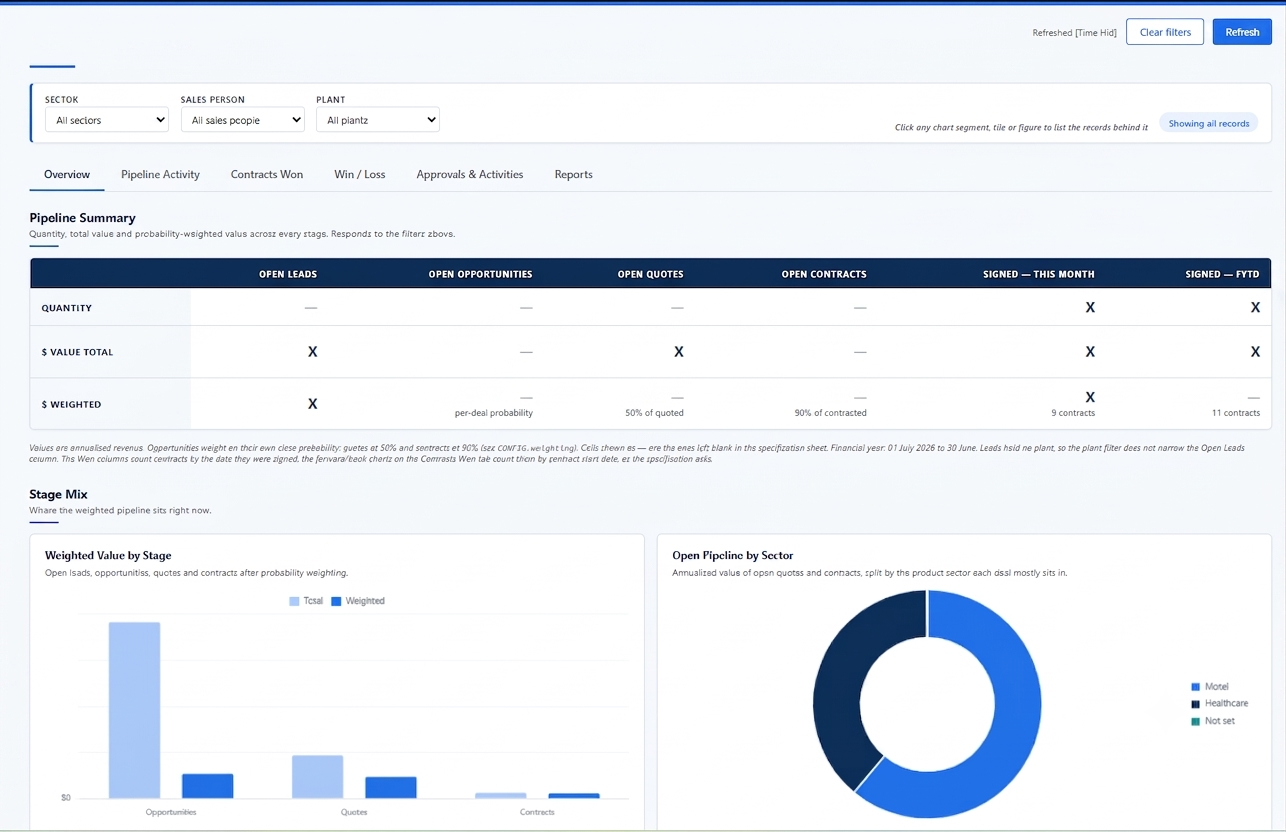
Counted from the parallel load: accounts, factories, depots, leads, opportunities, quotes, orders, quote lines, order lines, opportunity products, products, freight rates, delivery point risk assessments and activities.
The measurable change is not a faster chart. It is that questions which previously had no answer inside Dynamics 365 now have one, with the records attached.
- 6tabs replacing a scatter of single entity charts
- 3filters applied to every visual at once
- 21weeks of forward contract book, by start week
- 4sectors reported from product flags
- Sector unavailable as a grouping, because it sits on the product
- Value charts reading 0.00 from totalamount
- Contracts invisible, pointed at an empty contract table
- Each chart filtered against its own entity
- Sector rolled up through line items, primary for grouping and full list for filtering
- Money read from cannualrevenue and weeklyrevenue throughout
- Signed contracts read from salesorder, with read through to the quote
- Sector, sales person and plant applied across all six tabs together
- ◆Model the dimension onceSector, owner and plant resolve through one function per entity. Every chart, filter and export reads the same resolver, so a fix to the plant fallback fixed the whole page.
- ▲Register the records, not just the numbersAttaching source records at render time cost a few lines per chart and turned the dashboard from something to look at into something to work from.
- ■Export types, not stringsWriting real numbers and real dates into the workbook meant nobody had to clean the export before pivoting it.
- ●Name the date you meanSigned date and service start date answer different questions. Collapsing them into one broke both, and separating them was the single largest correction in the build.
Conclusion
The decision point here is narrow and worth stating plainly. When the value a business reports on is not stored on the record it reports against, the chart designer has run out of road, and the choice is to move the value onto the record or to compute it in code. We chose code because the flags belong on the product for good operational reasons, and denormalising them onto every quote would have created a second source of truth to keep in step.
That choice buys live data and click through, and it bills you in maintenance, paging and library hosting. Both sides of that trade should be on the table before anyone writes the first line of a web resource.
Get in touch
Dashboards that cannot answer your question?
If your Dynamics 365 charts cannot group on the value your business actually reports against, send us the data model and we will tell you whether it is a field change, a Power BI model or a custom page.
Connect With UsAuthor Profile

Shruti Gupta
Senior Consultant · CloudFronts
I am a Senior Consultant at CloudFronts with 5+ years of experience in Azure integrations and Dynamics 365 implementations. She specializes in building seamless, API-driven architectures and connecting enterprise systems across the Microsoft ecosystem. Passionate about solving complex integration challenges, she focuses on delivering scalable, production-ready solutions that drive real business outcomes.