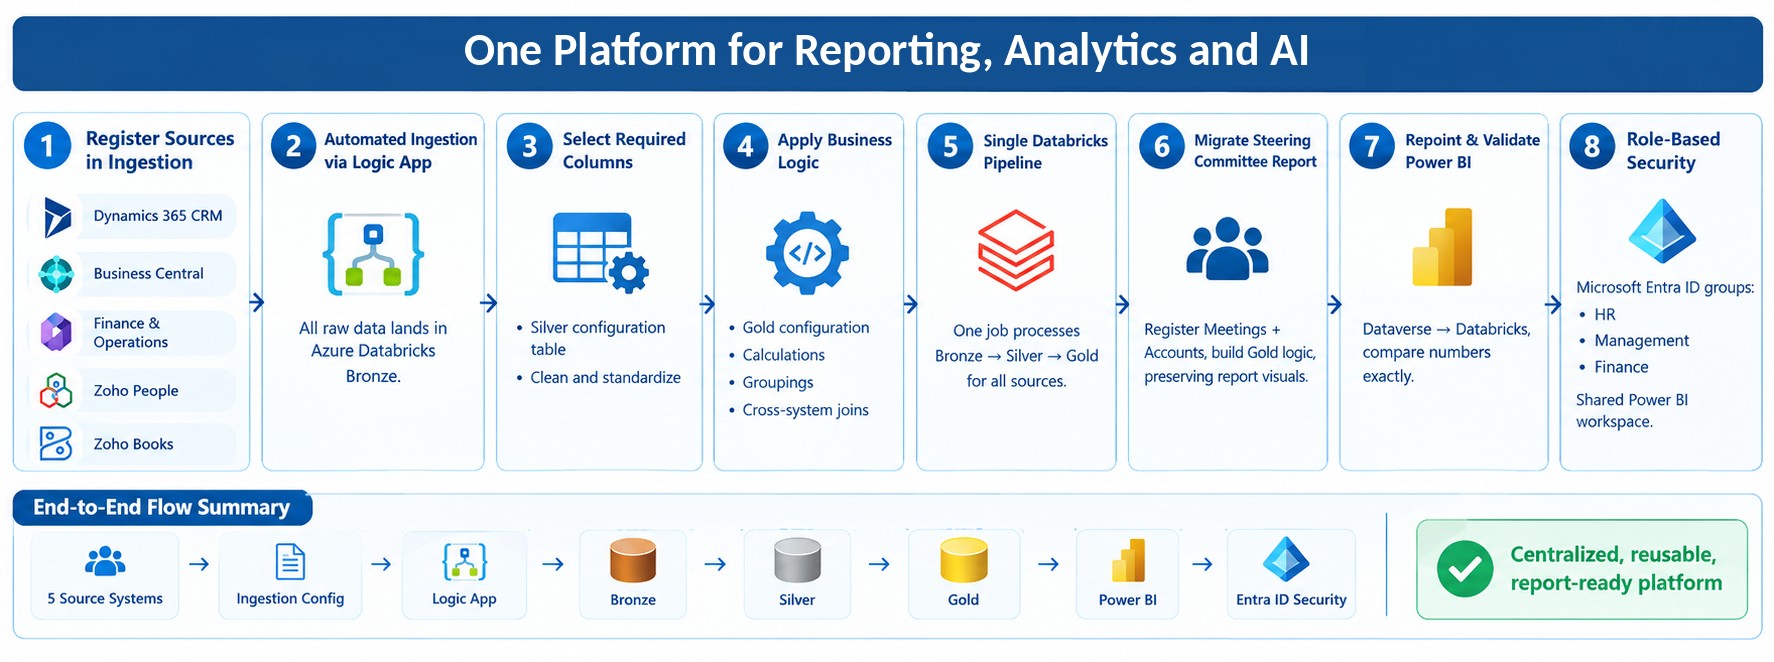

Six Currencies, Seven Entities, Zero Reconciliation Headaches: How Dynamics 365 Delivered Financial Clarity for an Oil & Gas and Marine Services Provider
Global energy service providers operate across multiple jurisdictions, currencies, and regulatory regimes. This complexity demands precision in financial reporting and transparency in profitability analysis. Achieving reliable site-level profitability in such an environment requires a holistic architectural approach to financial consolidation rather than incremental fixes or tactical workarounds.
Legacy State Challenges
- Fragmentation of Data: Financial and operational data was distributed across seven legal entities in India, the UAE, Brazil, Nigeria, and Singapore, with a holding structure in the British Virgin Islands.
- System Silos: ERP, CRM, and HRIS systems operated independently, with limited integration.
- Manual Reliance: Core processes depended heavily on Excel, creating duplication, reconciliation overhead, and audit complexity.
- Audit Burden: Statutory audits conducted twice annually required extensive manual reconciliation, increasing compliance risk.
Strategic Decision
The organization implemented Dynamics 365 Finance & Supply Chain as a unified financial backbone, replacing legacy IFS systems and spreadsheet-driven workflows. This decision was accompanied by a critical architectural trade-off: moving away from locally customized, entity-specific account structures toward a single, global Chart of Accounts (COA).
Benefits of Standardization
- Consistent Consolidation: Enabled uniform reporting across all entities.
- Regulatory Compliance: Supported statutory requirements at the local level while maintaining global consistency.
- Audit Readiness: Reduced reconciliation overhead and improved transparency.
- Scalability: Established a foundation for automated reporting and multi-entity visibility.
Unified COA Structure
The global COA was standardized using a 1000–6000 series:
- 1000: Assets
- 2000: Liabilities
- 3000: Revenue
- 4000: Direct Costs
- 5000: Indirect Costs
- 6000: Depreciation
This created a common financial language across the organization, enabling both global consolidation and local statutory compliance.
Engineering Derived Dimensions for Data Integrity
Standardizing accounts alone was insufficient to achieve granular profitability visibility. The architecture required a mechanism to enforce dimensional consistency and eliminate manual errors.
Derived Dimension Framework
Five core dimensions were defined: Segment, Sub-Segment, Region, State, and Site.
- Primary Driver: Site dimension acts as the anchor.
- Automated Derivation: When a Site is selected, the system automatically derives and populates Segment, Sub-Segment, Region, and State.
- Error Mitigation: Eliminates manual entry of multiple attributes, reducing inconsistency.
System Integration
- Embedded directly into Dynamics 365 Finance & Operations.
- Enforces data integrity at the point of entry rather than relying on downstream corrections.
- Ensures dimensional accuracy across all financial transactions.
Operational Customization
- On-hand inventory screens were tailored to display stock balances filtered by Site code and description.
- Inventory visibility aligned with the same financial dimensions used in profitability reporting.
- Maintained consistency between operational and financial views of the business.
From Static Spreadsheets to Dynamic Power BI Dashboards
Legacy Reporting
- Profitability was calculated monthly using spreadsheets.
- Manual consolidation and updates limited visibility.
- High dependency on human intervention increased risk of error.
Modernized Workflow
- Automated Power BI reporting replaced manual spreadsheets.
- Profit and Loss Actual versus Budget analysis integrated directly with Dynamics 365 Finance & Operations.
- Continuous visibility into performance without recalculation.
Reporting Model
- DAX measures calculate Actuals (Year-to-Date), Budget (Year-to-Date), and Variance.
- Real-time snapshots of financial performance as transactions are posted.
- Drill-through functionality allows users to move from summary views into detailed breakdowns of Revenue, Expenses, and Gross Profit by Segment or legal entity.
Operational Cadence
- Reports refreshed three times daily at 9:00 AM, 3:00 PM, and 6:00 PM IST.
- Replaced manual daily Excel updates with system-driven reporting.
- Increased timeliness and reliability of financial insights.
Frameworks
- Derived Dimension Mapping: Site → Segment, Sub-Segment, Region, State
- The 6-Series COA Model:
- Assets (1000)
- Liability (2000)
- Revenue (3000)
- Direct Cost (4000)
- Indirect Cost (5000)
- Depreciation (6000)
Proof and Metrics
- Entities Consolidated: Seven transaction-level legal entities unified under one BVI holding company.
- Currency Scale: Six global currencies managed seamlessly (INR, USD, SGD, AED, NGN, BRL).
- Reporting Frequency: Power BI reports refreshed three times daily.
- Project Timeline: Initial engagement began July 25, 2022; master services agreement extends through February 2026
Step-by-Step Implementation Playbook
- COA Consolidation: Standardize the 1000–6000 account series across all global entities.
- Dimension Definition: Identify project-specific dimensions such as Site and Sub-Segment to enable granular tracking.
- Derived Logic Setup: Configure Dynamics 365 so selecting a primary dimension automatically populates secondary dimensions.
- Budget Integration: Upload department-wise and project-wise budgets using the Excel add-in for real-time comparison.
- Power BI Mapping: Deploy the P&L Actual versus Budget report using DAX to calculate variances across Revenue, COGS, and EBITDA.
- Scheduled Refresh: Set up Power Automate flows to synchronize data between Dynamics 365 Finance & Operations and Power BI.
FAQs
a. How do you handle different fiscal years?
The system supports reporting for both January–December and April–March fiscal calendars to meet diverse statutory requirements.
b. Can we track unbilled revenue?
Yes. Project Management modules track planned versus actual work, allowing finance teams to post and reverse accrued revenue monthly.
c. What happens if a site selects the wrong dimension?
This risk is mitigated through derived dimensions, which automatically populate dependent dimensions based on the selected Site code.
To conclude, this architecture not only addresses immediate challenges but also positions the organization for long-term sustainability. It enables leadership to make informed decisions based on reliable, timely data, while ensuring compliance across diverse regulatory environments. Ultimately, the shift represents a move from reactive financial management to proactive, strategic control-delivering clarity, accountability, and resilience across global operations.
Connect with CloudFronts to get started at transform@cloudfonts.com
Related posts:

From Project Operations to Business Central: Following the Data Behind Project Financials
Location-Based Item Based Visibility in Business Central for a Maldives-Based Marine Services Firm
Connecting Project Operations to Finance: Our Dataverse-to-Business Central Integration for Project ...