

How We Built a Real-Time Lightweight Financial Statement Reporting Experience Directly Inside D365 PO for a Texas-Based Cybersecurity Firm
Summary
- Designed and deployed a lightweight, real-time financial statement reporting solution directly inside Microsoft Dynamics 365 Project Operations for a Texas-based Cybersecurity & AI Business Solutions firm.
- Eliminated dependency on heavy paginated reporting and large-scale Power BI datasets for operational financial visibility.
- Built an interactive HTML + JavaScript reporting framework embedded natively within Dynamics 365 CRM.
- Enabled dynamic filtering, instant report rendering, and printable customer-ready statements directly from the CRM interface.
- Introduced popup-based full-screen report rendering for detailed review and print-ready output without leaving Dynamics 365.
- Integrated funding balances, allocations, transactions, installment schedules, and financial snapshots into a single operational reporting experience.
- Reduced reporting development complexity, minimized data transformation overhead, and improved scalability compared to traditional BI-heavy architectures.
- Created a highly maintainable reporting model that scales efficiently as operational datasets grow without introducing significant Power BI licensing or performance constraints.
Table of Contents
1. Introduction
As organizations scale, operational reporting often becomes increasingly difficult to maintain.
For a Texas-based Cybersecurity & AI Business Solutions firm operating on Microsoft Dynamics 365 Project Operations, this challenge became especially visible in financial agreement tracking and customer funding visibility.
The business already had access to reporting platforms such as Power BI and paginated reports. However, these approaches introduced several operational problems:
- Long development cycles
- Heavy data-cleaning requirements
- Complex transformation pipelines
- Delayed visibility into operational data
- Increasing licensing costs as datasets expanded
- Slow report rendering for operational users
- Dependency on external reporting infrastructure
Instead of another external BI layer, the organization wanted a lightweight operational reporting experience directly inside Dynamics 365 CRM itself.
The Goal:
Build a real-time, CRM-native financial reporting experience that renders instantly, supports dynamic filtering, enables printing, and scales without heavy BI infrastructure.
2. The Business Problem
The organization manages multiple long-running service agreements, funding allocations, installment schedules, and customer financial balances across cybersecurity services, managed services, and AI solution engagements.
Operational users needed a consolidated statement experience that could answer questions such as:
- What is the customer’s current available balance?
- Which transactions impacted the balance during a selected period?
- Which allocations are currently active?
- How much funding has been consumed vs allocated?
- Which installments are pending, paid, or overdue?
- What does the latest funding snapshot look like?
- Can the report be reviewed and printed directly from CRM?
Paginated Reporting Limitations
- Increasing query complexity
- Performance degradation with larger datasets
- Heavy formatting maintenance
- Limited interactivity
- Rigid deployment cycles
Power BI Challenges
- Significant Power Query transformations
- Data-cleaning pipelines
- Incremental refresh considerations
- Dataset refresh latency
- Licensing growth with scale
- Overengineering for transactional operational reporting
3. The Solution Architecture
The reporting framework was designed as a native Dynamics 365 embedded reporting experience using:
- HTML Web Resources
- JavaScript
- Dynamics 365 Web API
- Native CRM navigation APIs
- Real-time entity retrieval
- Popup-based print rendering
Embedded Operational Report
- Apply filters
- Select funding records
- Choose reporting periods
- Generate statements instantly
- Navigate operational financial data
Popup Print Report
- Detailed review
- Executive presentation
- Customer-facing statements
- Printing and PDF generation
4. Real-Time CRM-Native Reporting
One of the most important architectural decisions was avoiding external data replication entirely.
Instead of pushing transactional data into a separate reporting warehouse, the report retrieved data directly from Dynamics 365 using the native Web API.
- Real-time visibility
- Zero synchronization lag
- Reduced infrastructure complexity
- Lower maintenance overhead
- Faster deployment cycles
Everything rendered on demand inside the CRM session itself.
5. Lightweight Front-End Reporting Framework
The reporting experience was intentionally designed to behave more like a modern application than a traditional report.
Dynamic Filter Bar
Users could dynamically filter reports using:
- This Month
- Last Month
- This Quarter
- Current Year
- Custom Date Ranges
- Funding Status
- Funding Selection
The report regenerated instantly without page reloads.
Responsive Report Rendering
The reporting layout dynamically populated:
- Account Summary
- Transaction Details
- Allocation Summary
- Installment Details
- Detailed Account Summary
Each section rendered independently based on live API responses.
Intelligent Empty-State Handling
Instead of showing blank tables or errors, the framework displayed contextual empty-state messaging such as:
- “No transactions during this statement period”
- “No active allocations”
- “No installment details available”
This significantly improved usability for operational teams.
6. Popup-Based Printable Report Experience
A major requirement was enabling users to thoroughly review and print reports directly from CRM.
To solve this, the solution introduced a dedicated popup rendering architecture.
Users could click:
“Expand Report”
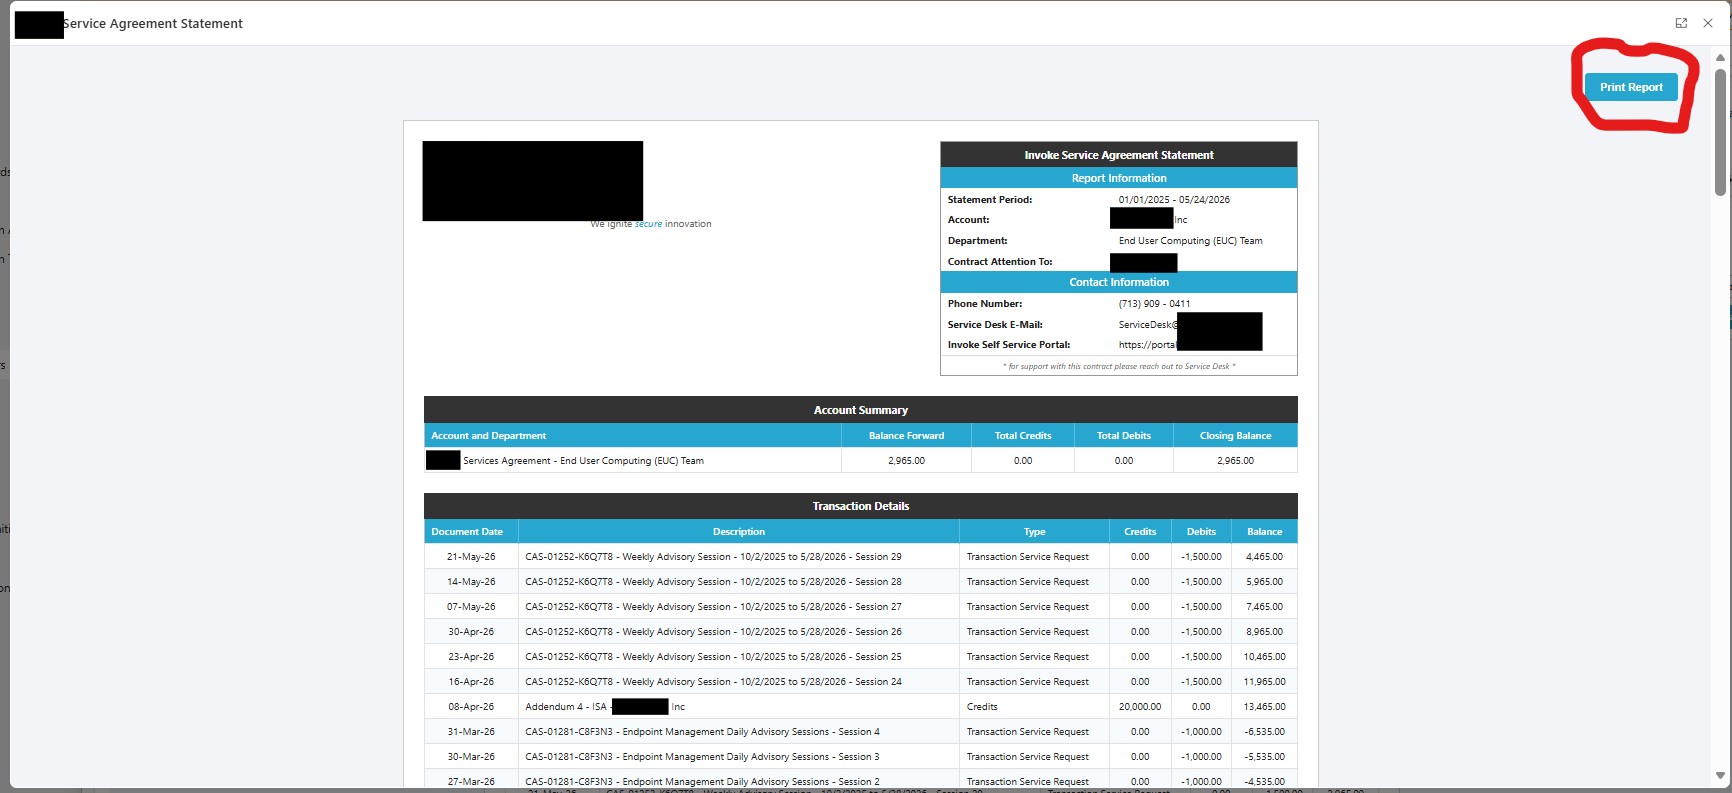
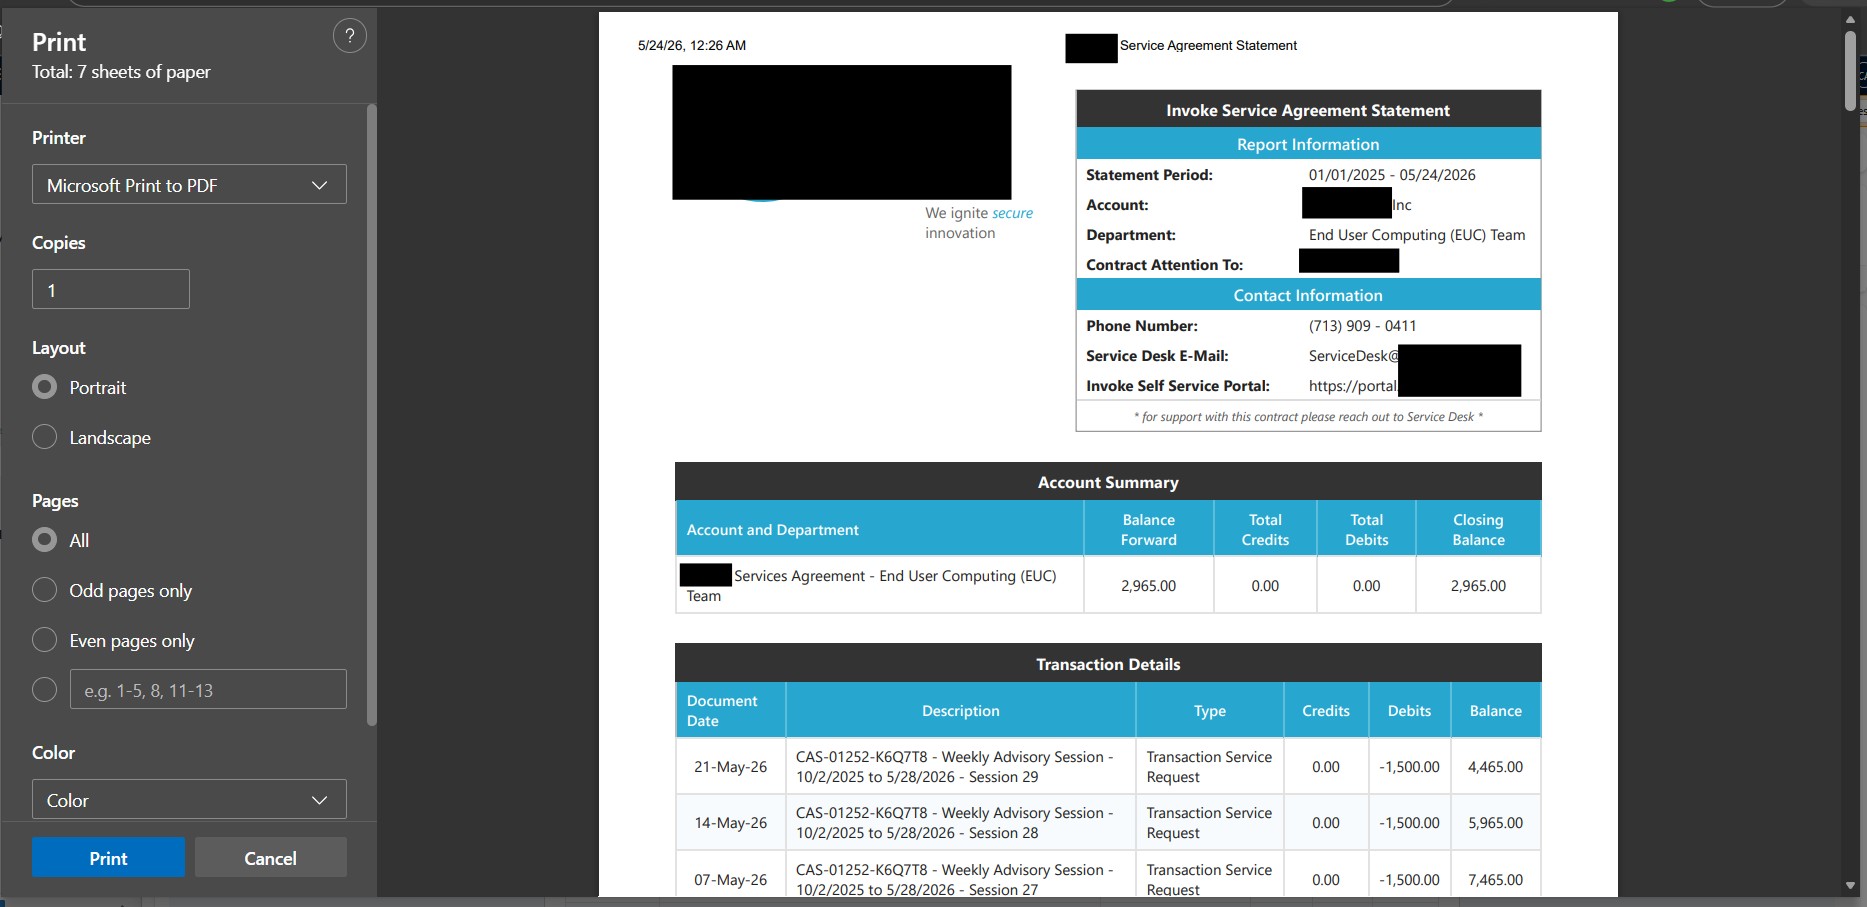
This launched a fullscreen popup using Dynamics 365 navigation APIs with:
- Large-format rendering
- Print-optimized layout
- Full customer statement formatting
- Multi-page support
- Consistent branding
- Printable tables
- Customer reference guides
The popup approach delivered several advantages:
- Better readability
- Cleaner print formatting
- Improved executive review experience
- Isolation from CRM form clutter
- Easier PDF generation
Most importantly, the popup still worked entirely against live CRM data.
7. Data Model and Reporting Components
The report consolidated multiple operational areas into a single experience.
Account Summary
Provided a high-level balance overview including:
- Balance Forward
- Total Credits
- Total Debits
- Closing Balance
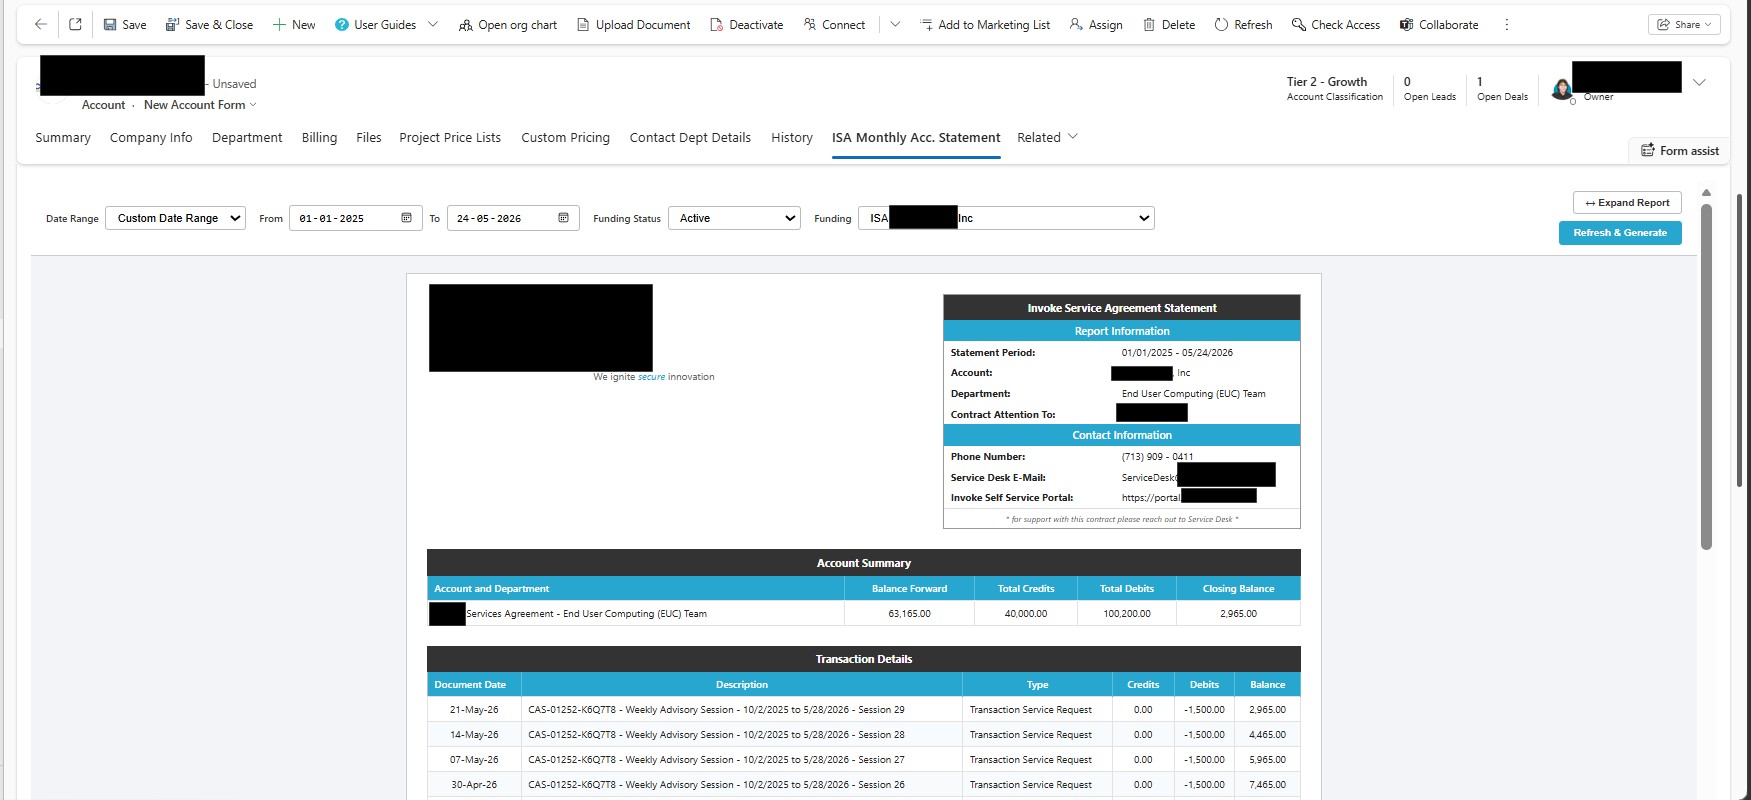
This gave immediate visibility into customer financial standing.
Transaction Details
Displayed detailed running balance activity including:
- Document date
- Transaction description
- Service type
- Credits
- Debits
- Running balance
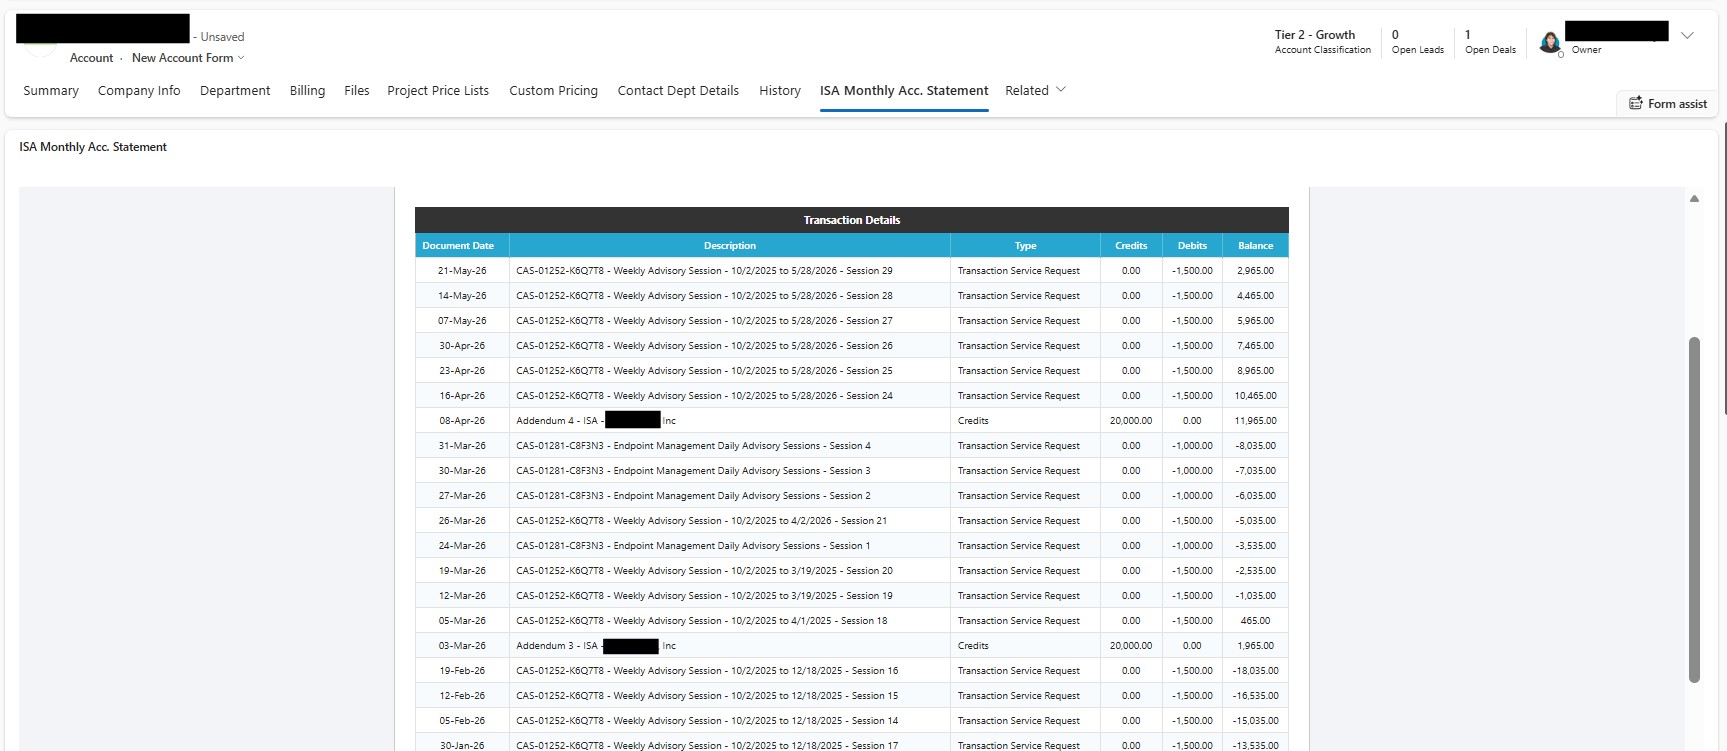
Transactions dynamically recalculated balances during rendering.
Allocation Summary
Tracked funding allocation activity including:
- Allocated funds
- Consumed funds
- Remaining balance
- Allocation status
Returned allocations were handled separately with custom date logic.
Installment Tracking
Displayed installment lifecycle visibility including:
- Invoice dates
- Due dates
- Payment dates
- Payment terms
- Installment status
The report intelligently handled future-dated payments and pending statuses.
Detailed Funding Snapshot
Displayed operational funding metrics including:
- Starting Balance
- Contracted Funds
- Total Budgeted Funds
- Collected Funds
- Used Funding
- Available Funds
- Allocated Funds
- Unallocated Funds
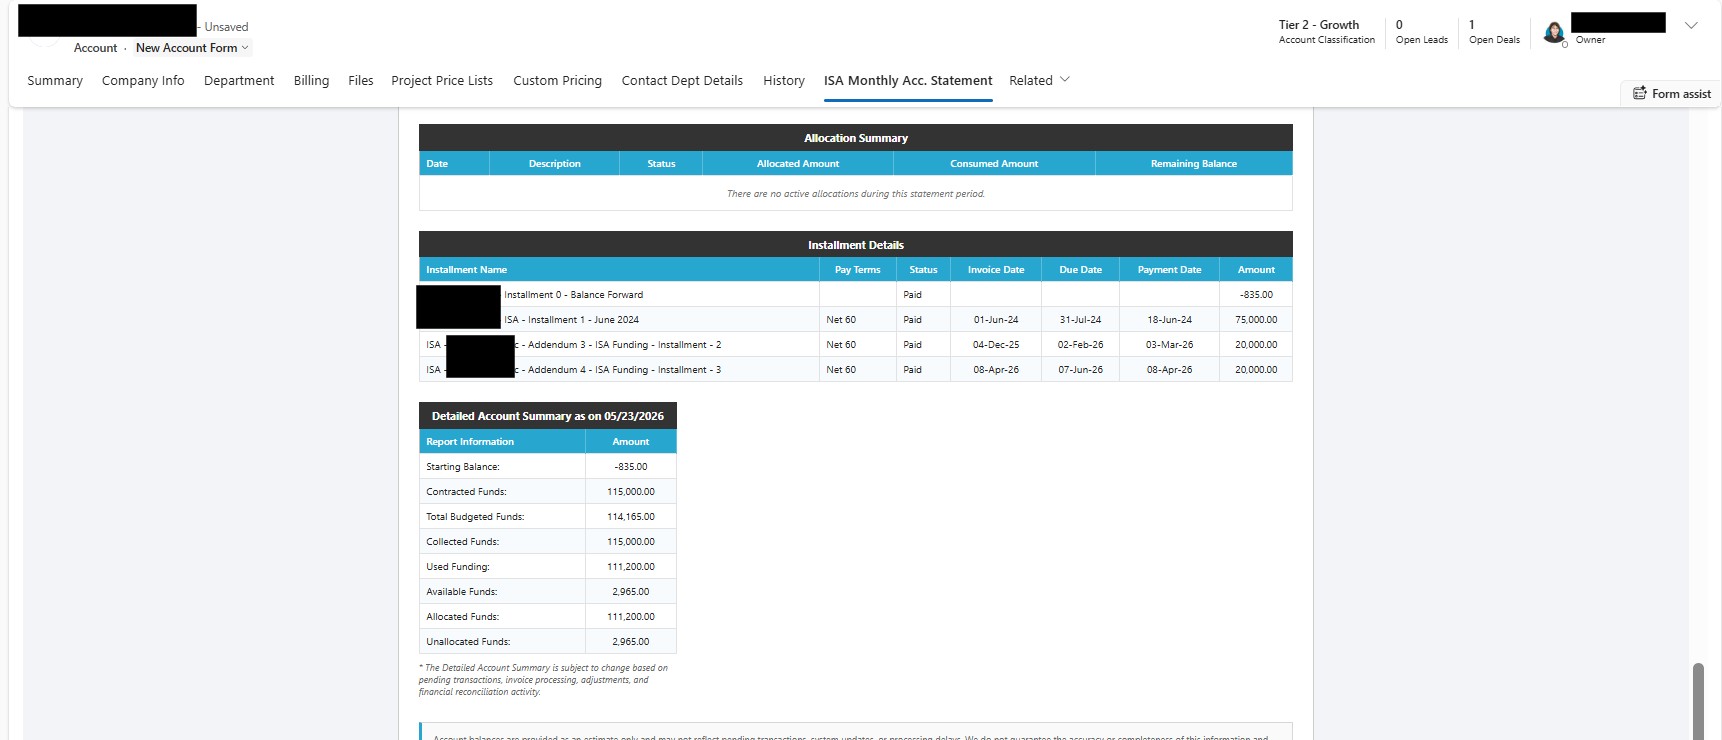
This created a complete operational funding overview within a single screen.
8. Design Principles
Several architectural principles guided the solution.
Real-Time Over Batch Processing
Operational reporting should reflect current business activity immediately.
The solution avoided overnight refresh cycles entirely.
Lightweight Over Heavy BI
Not every operational report requires a full BI platform.
For transactional reporting, lightweight CRM-native rendering is often significantly more efficient.
Operational Simplicity
- ETL complexity
- Dataset management
- Semantic modeling overhead
- Data duplication
Maintainability
The HTML + JavaScript architecture allowed rapid iteration without requiring large BI redevelopment cycles.
Print-First Operational Design
The popup experience ensured reports were suitable for:
- Customers
- Finance teams
- Executives
- Operational audits
without requiring export tooling.
9. Business Impact
The reporting framework delivered significant operational improvements.
Faster Reporting Delivery
New reporting requirements could be implemented rapidly without extensive BI modeling.
Reduced Power BI Dependency
Operational teams no longer required large Power BI datasets for transactional statement visibility.
Lower Licensing Pressure
By avoiding unnecessary dataset expansion, the organization reduced long-term scalability concerns around Power BI licensing.
Real-Time Operational Visibility
Users could access live customer financial data directly inside CRM.
Improved User Experience
The embedded report and popup experience dramatically simplified operational workflows.
Reduced Maintenance Overhead
- Data engineering effort
- Transformation maintenance
- Report synchronization issues
10. Why This Approach Worked
A key lesson from this implementation is that not every reporting problem should be solved using enterprise BI tooling.
For analytical dashboards and enterprise KPI modeling, Power BI remains extremely powerful.
But for operational transactional reporting inside Dynamics 365:
- Lightweight embedded reporting can be faster
- Easier to maintain
- More scalable operationally
- Less expensive
- More responsive for users
The solution succeeded because it aligned the reporting architecture with the actual operational use case.
11. FAQs
Why not simply use Power BI paginated reports?
Paginated reports introduced higher maintenance overhead, slower rendering, increased query complexity, and reduced interactivity for operational users.
The embedded CRM-native approach provided faster and more flexible operational reporting.
Why was real-time rendering important?
Operational users needed live financial visibility directly against current CRM data without waiting for scheduled dataset refreshes or synchronization pipelines.
Why use popup rendering instead of exporting?
The popup provided:
- Better readability
- Print optimization
- Fullscreen review
- Consistent formatting
- Cleaner operational workflows
without requiring export dependencies.
Did this replace Power BI entirely?
No.
Power BI remained valuable for analytical and executive BI scenarios.
This solution specifically targeted operational statement-style reporting where lightweight real-time rendering was more effective.
12. Conclusion
This implementation demonstrated how Microsoft Dynamics 365 Project Operations can support sophisticated real-time operational reporting without relying entirely on traditional BI-heavy architectures.
By combining:
- Native CRM web resources
- Dynamics 365 Web API
- Lightweight JavaScript rendering
- Popup-based printable experiences
the organization achieved a scalable, maintainable, and highly responsive financial reporting solution directly inside CRM.
The result was faster visibility, reduced reporting overhead, improved operational efficiency, and a significantly better end-user experience for both internal teams and customers.
Ready to modernise your BI & Reporting against your D365 Project Operations?
CloudFronts builds scalable Power Platform and Dynamics 365 solutions that replace legacy reporting infrastructure. Reach out at transform@cloudfronts.com.
Shashank Keny
Associate Consultant · CloudFronts
Shashank Keny is an Associate Consultant at CloudFronts with 1.5+ years of experience in cloud, data, and business applications. He specializes in building scalable, API-driven architectures and integrating enterprise systems across the Microsoft ecosystem.
He is a Certified Databricks Data Engineer with hands-on experience in Dynamics 365 Project Operations and Dynamics 365 Sales, along with delivering business intelligence solutions using Power BI.
His expertise also extends to modern AI solutions, including building custom copilots and implementing intelligent applications using Azure AI Foundry.
Passionate about solving real-world business challenges through data and AI, he focuses on delivering efficient, scalable, and production-ready solutions.
- Experience: 1.5+ years
- Certification: Databricks Certified Data Engineer
- Specialization: Dynamics 365 Project Operations, Power BI, Azure Integrations, AI Solutions