How we designed & deployed an Income Pipeline Report for a Texas, U.S. based Cybersecurity & AI Business Solutions Firm, via MS D365 Project Operations and Power BI.
Summary
- Designed a two-page Power BI Income Pipeline Report for a Texas-based Cybersecurity & AI Business Solutions firm using Microsoft Dynamics 365 Project Operations.
- Unified visibility across Opportunity, Unbilled Income, Billed Income, and Paid Income in a single view.
- Introduced Average Turnaround to forecast realistic cash collection timelines based on actual payment behavior.
- Integrated Dynamics 365 Project Operations with QuickBooks to connect sales, delivery, invoicing, and cash collection.
- Enabled a 17-week rolling revenue forecast with week-by-week cash visibility.
- Provided dual invoice status for contractual vs realistic payment tracking.
Table of Contents
1. Introduction
Managing revenue across a professional services firm is rarely straightforward. When your business spans cybersecurity assessments, AI-driven solutions, and long-term managed services engagements, the gap between work being delivered and cash actually landing in the bank can be wide — and costly if left unmonitored.
This is precisely the challenge we set out to solve for a U.S.-based Cybersecurity and AI Business Solutions firm running their operations on Microsoft Dynamics 365 Project Operations. The result was a two-page Power BI report — the Income Pipeline Report — that gives leadership a real-time, end-to-end view of every dollar moving through the business: from early-stage opportunity, through unbilled and billed income, all the way to cash collected.
This post walks through how the report was built, how each data layer was modelled, and why the design decisions were made the way they were.
2. The Business Problem
The firm needed clarity across four distinct but connected stages of their revenue lifecycle:
- Sales opportunities and pipeline value
- Delivered but unbilled work
- Outstanding invoices and expected payments
- Actual vs expected payment behavior
This would answer as well as resolve the following questions –
- Where are active sales opportunities sitting, and how much pipeline value do they represent?
- Which project work has been delivered but not yet invoiced?
- Which invoices have been raised and sent to clients, and when are they realistically going to be paid?
- And finally, how does actual payment behaviour compare against what was expected?
- Project managers had partial visibility into their own contracts, and needed a comprehensive bird’s eye view of all of these together.
- Finance had QuickBooks data but lacked the context of the delivery pipeline.
- Leadership had no consolidated view.
The Income Pipeline Report brought all of this together in a single, navigable Power BI experience.
3. Report Structure Overview
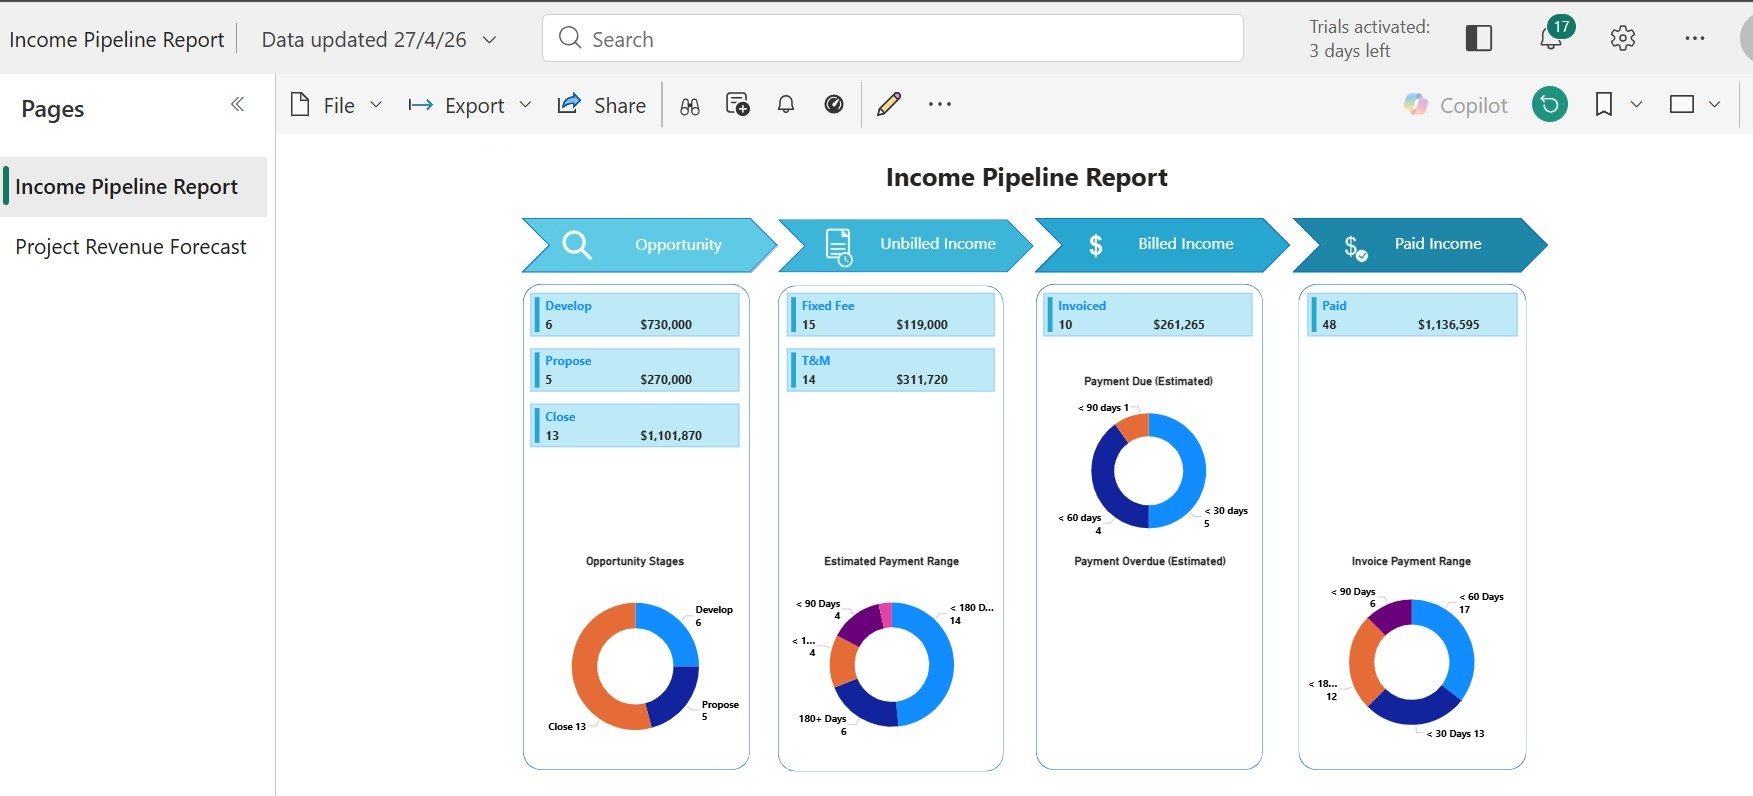
The report consists of two pages:
-
Income Pipeline Report — a high-level pipeline view across four stages: Opportunity, Unbilled Income, Billed Income, and Paid Income, each with summary cards and interactive donut charts.
-
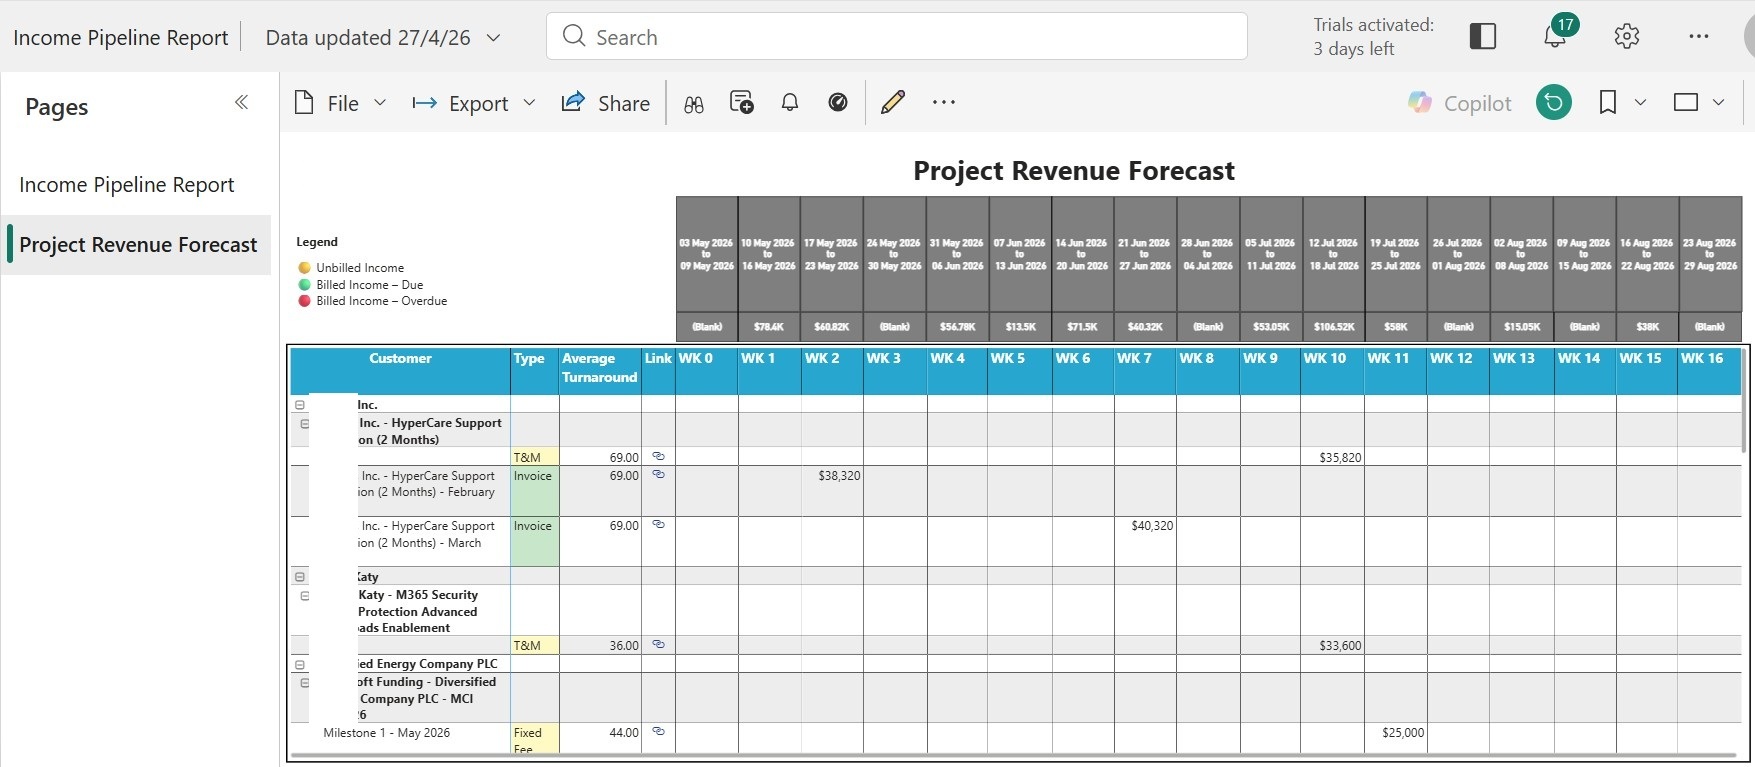
Project Revenue Forecast — a time-distributed breakdown of expected cash collection across a rolling 17-week horizon, organised by customer and contract.
4. The Income Pipeline
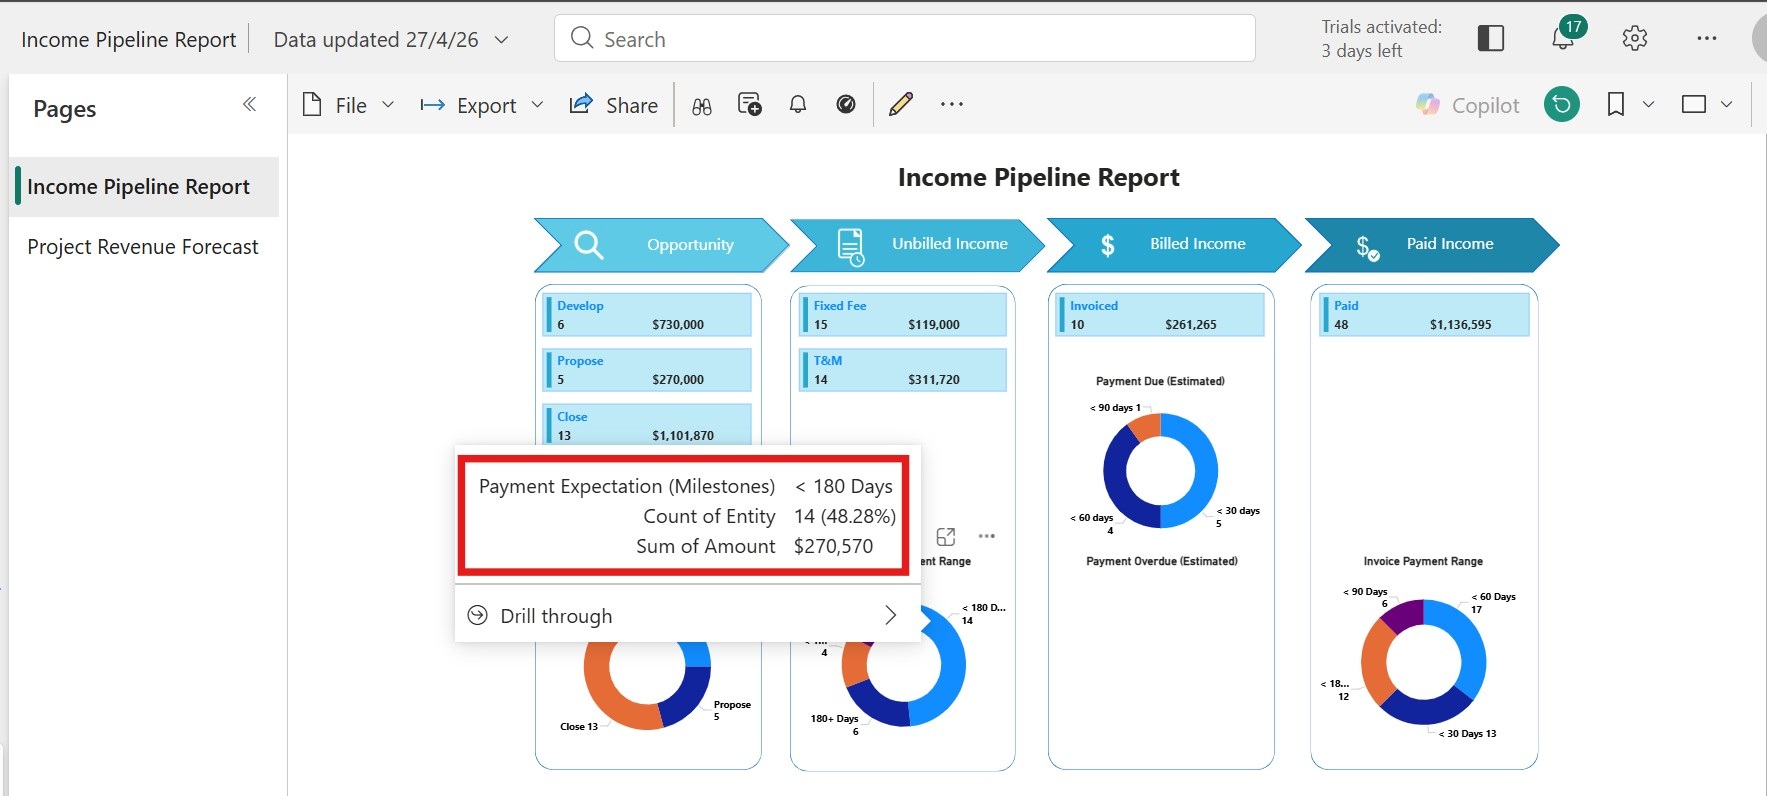
The Four-Stage Pipeline Banner
Across the top of the report, four chevron-style stage indicators guide the revenue journey:
Opportunity → Unbilled Income → Billed Income → Paid Income
- Each stage includes a summary card showing record count and total value
- Provides immediate visibility into where revenue is sitting
- Highlights potential bottlenecks across the pipeline
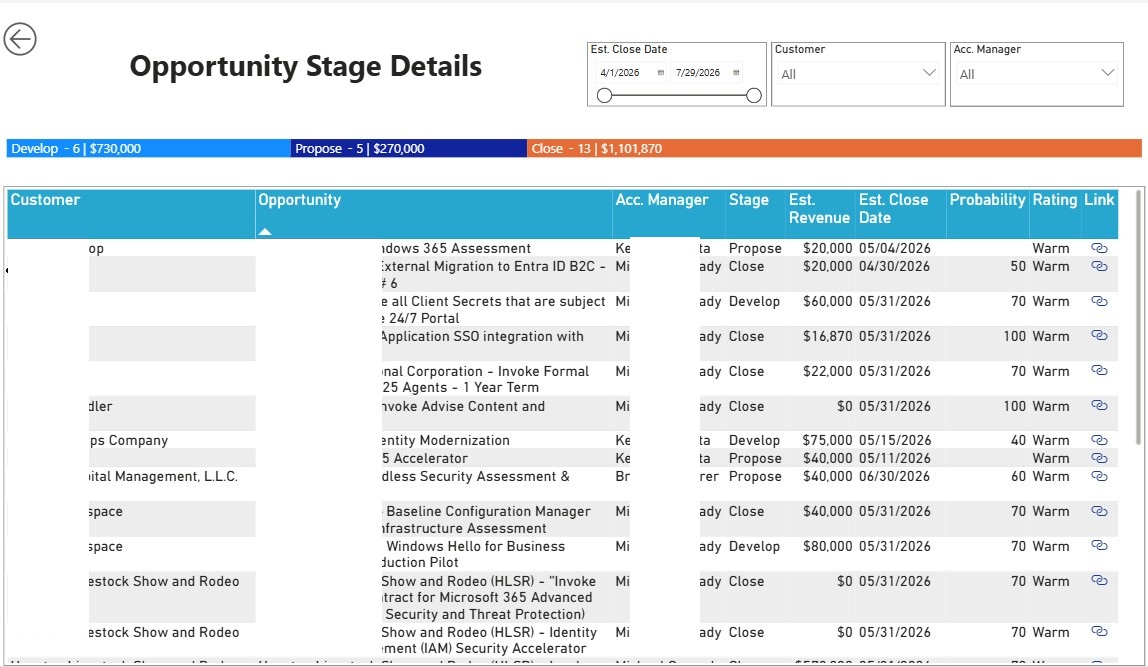
Stage 1 — Opportunity
- Data sourced from Dynamics 365 Sales using Business Process Flow (BPF)
- Uses active BPF stage (Develop, Propose, Close) instead of static fields
- Ensures accurate reflection of real sales progression
- Estimated revenue pulled directly from opportunity records
- Donut chart shows distribution across Develop, Propose, and Close stages
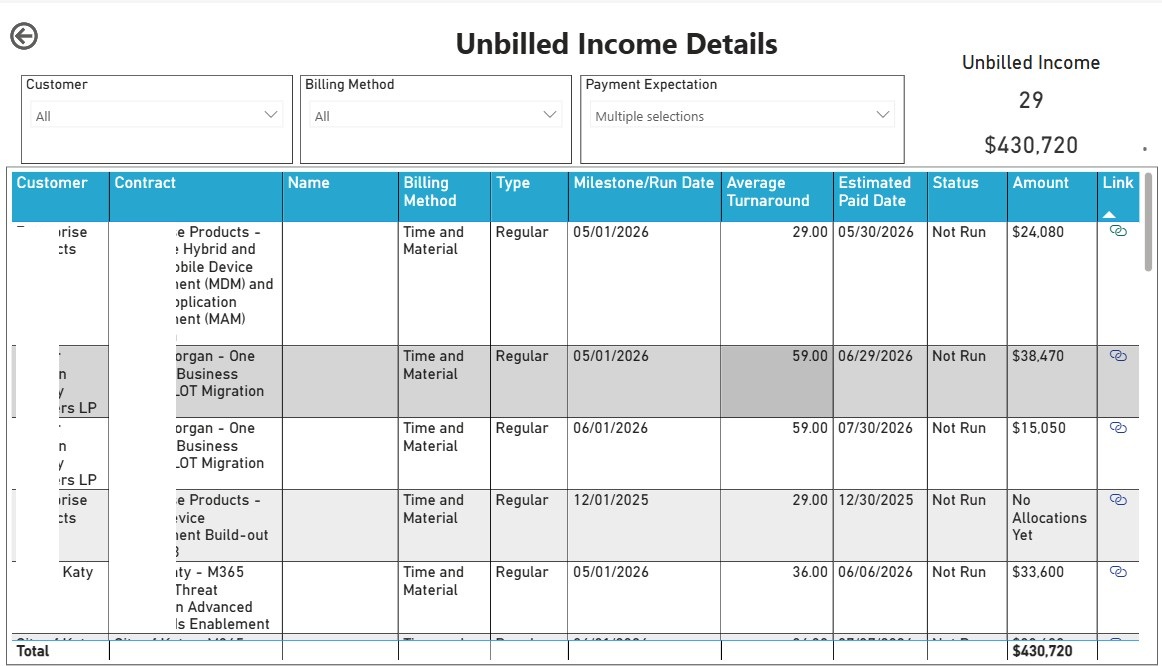
Stage 2 — Unbilled Income
- Represents contracted or delivered work not yet invoiced
- Sourced from project contract lines in Dynamics 365 Project Operations
- Includes:
- Fixed Fee milestones (explicit values)
- Time & Material (T&M) estimates based on resource allocations
- T&M calculated as allocated hours × billing rate
- Clearly marked as estimated until billing run is executed
- Grouped into payment expectation buckets (30, 60, 90, 120, 180+ days)
- Uses Average Turnaround to forecast realistic payment timing
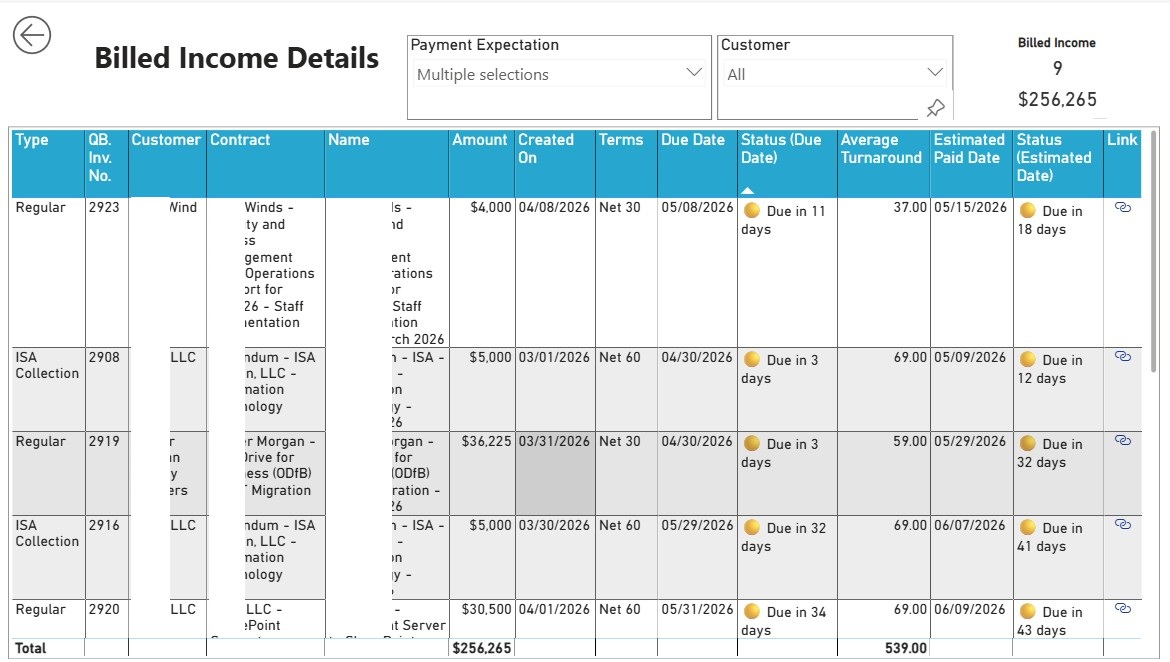
Stage 3 — Billed Income (Confirmed Invoices)
- Combines Dynamics 365 Project Operations and QuickBooks data
- Tracks invoices that are confirmed and sent to clients
- Introduces Average Turnaround:
- Average days from invoice creation to payment
- Based on historical payment behaviour
- Each invoice has two statuses:
- Contractual (due date)
- Estimated (based on Average Turnaround)
- Provides realistic vs contractual payment visibility
- Includes:
- Due-date based categorisation
- Estimated overdue analysis
- Prevents misleading insights from strict payment terms alone
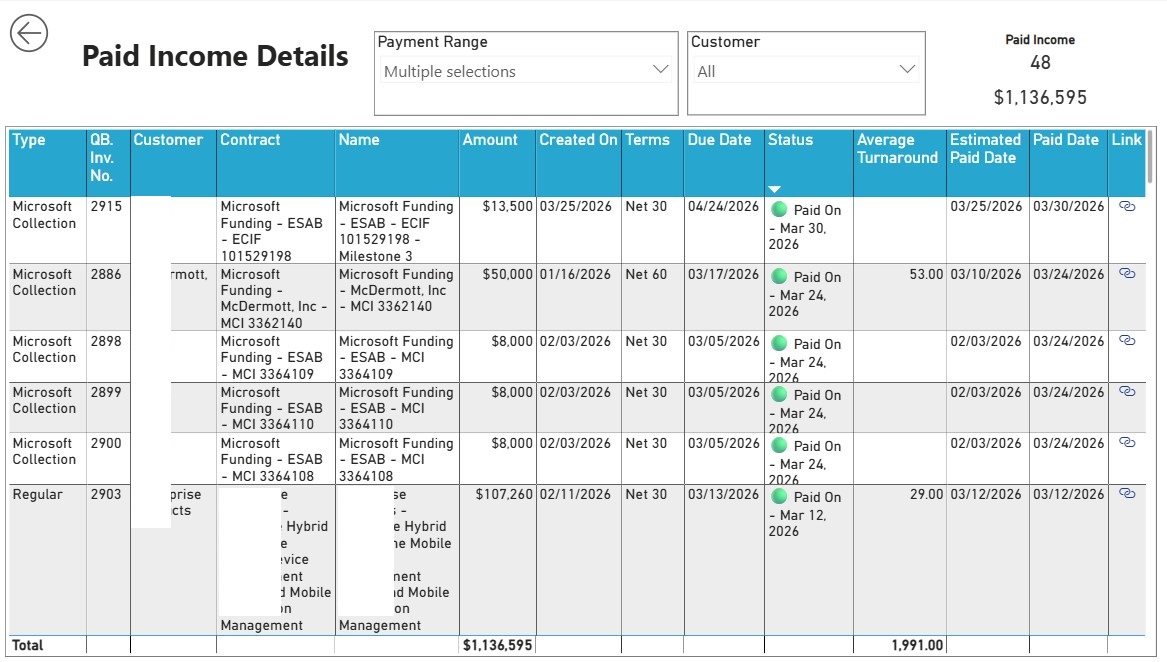
Stage 4 — Paid Income
- Tracks fully collected invoices
- Uses QuickBooks for actual payment dates
- Groups payments by time bands (under 30, 60, 90 days, etc.)
- Enables comparison between actual vs estimated payment behaviour
- Continuously improves accuracy of Average Turnaround
Tooltip Drill-Down
- Hover shows:
- Payment band
- Record count
- Total value
- Drill-through available for detailed record-level analysis
5. Project Revenue Forecast
Overview
- Distributes expected cash collection across a rolling 17-week window
- Shifts view from pipeline stage to time-based forecasting
Hierarchy and Structure
- Customer → Contract → Revenue Type
- Revenue types include:
- T&M run schedules
- Fixed Fee milestones
- Confirmed invoices
- Each row shows:
- Customer
- Contract
- Billing type
- Average Turnaround
- Value mapped to expected payment week
- Weeks range from Week 0 to Week 16
- Top row aggregates total expected cash per week
Colour Coding
- Amber — Unbilled income
- Green — Invoice within terms
- Red — Overdue (based on estimated payment date)
Drill-Through to Detail
- Click any row to view detailed breakdown
- Includes:
- Billed invoices with due and estimated dates
- Unbilled milestones and run schedules
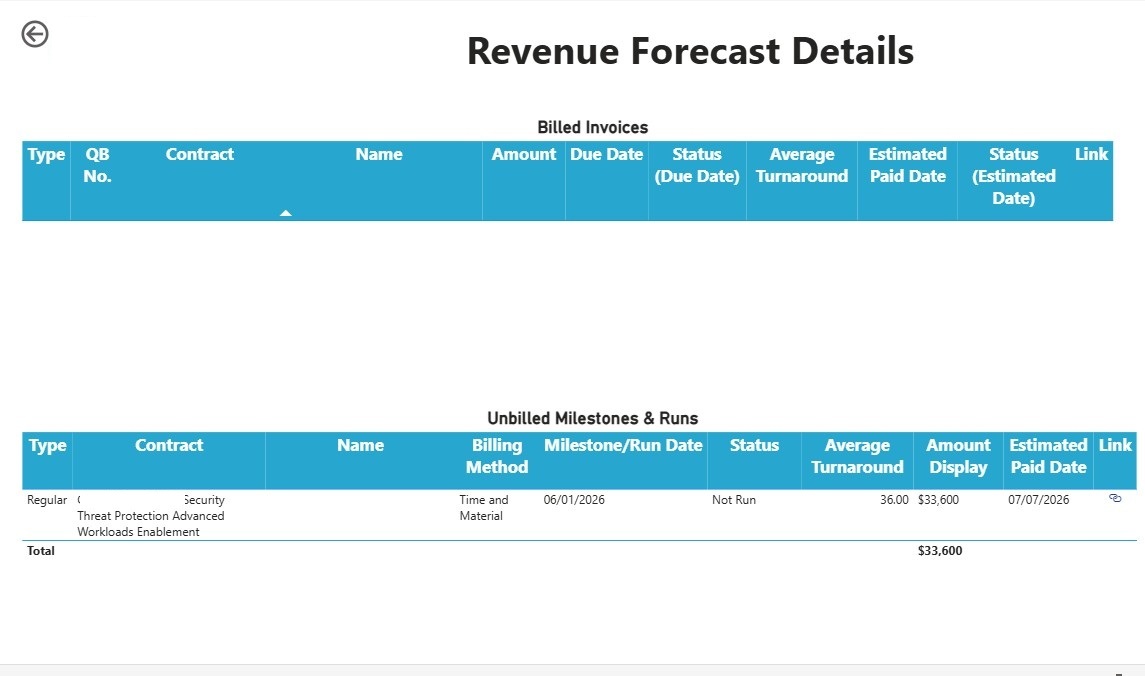
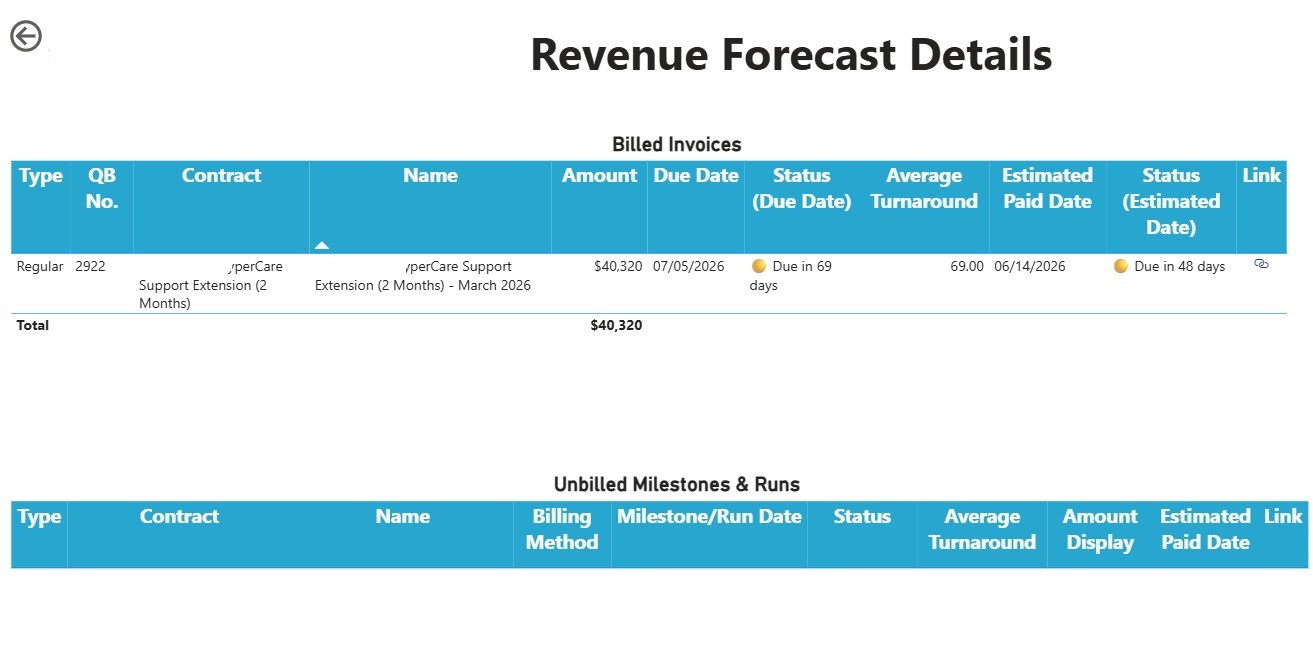
- Connects high-level forecast to transactional detail
6. Design Principles
-
Average Turnaround over payment terms
Reflects actual customer behaviour instead of contractual assumptions. -
Dual invoice status
Provides both contractual and realistic payment visibility. -
Consistent time buckets
Ensures comparability across Opportunity, Unbilled, Billed, and Paid stages. -
Weekly forecasting instead of monthly
Supports short-term cash flow planning aligned with operational rhythm.
7. Business Impact
- Improved cash flow predictability
- Earlier visibility of at-risk invoices
- Unified cross-team visibility
- Improved T&M billing discipline
- Increased accountability
8. FAQs
What is Average Turnaround and why does it matter?
It is the mean number of days a client historically takes to pay from invoice creation to settlement — used to forecast realistic cash collection dates rather than relying on contractual terms alone.
How are T&M amounts estimated before an invoice is raised?
By multiplying each team member’s allocated hours against their billing rate within D365 Project Operations, clearly labelled as an estimate until the billing run is formally executed.
What does the dual invoice status mean in practice?
Each confirmed invoice carries two statuses — one against the contractual due date and one against the estimated payment date — giving finance both the formal position and the realistic expected position in a single view.
9. Conclusion
The Income Pipeline Report provides a single, trusted view of revenue from opportunity to cash collection.
By combining Dynamics 365 Project Operations with QuickBooks and introducing behavioral forecasting, the firm improved both financial visibility and decision-making.
Ready to modernise your BI & Reporting against your D365 Project Operations?
CloudFronts builds scalable Power Platform and Dynamics 365 solutions that replace legacy reporting infrastructure. Reach out at transform@cloudfronts.com.

Shashank Keny
Associate Consultant · CloudFronts
Shashank Keny is an Associate Consultant at CloudFronts with 1.5+ years of experience in cloud, data, and business applications. He specializes in building scalable, API-driven architectures and integrating enterprise systems across the Microsoft ecosystem.
He is a Certified Databricks Data Engineer with hands-on experience in Dynamics 365 Project Operations and Dynamics 365 Sales, along with delivering business intelligence solutions using Power BI.
His expertise also extends to modern AI solutions, including building custom copilots and implementing intelligent applications using Azure AI Foundry.
Passionate about solving real-world business challenges through data and AI, he focuses on delivering efficient, scalable, and production-ready solutions.
- Experience: 1.5+ years
- Certification: Databricks Certified Data Engineer
- Specialization: Dynamics 365 Project Operations, Power BI, Azure Integrations, AI Solutions
