Narratives for Power BI
Introduction:
Narratives for Power BI is a product that automatically delivers dynamic narratives that explain the insights within your data. No more manually writing explanations and spending time interpreting data. Instead, the narratives, which are powered by advanced analytics, are perceptive and dynamic and explain what is most interesting and important in your data. Drill down deeper into your data and watch narratives update in real-time during the data discovery process
Steps:
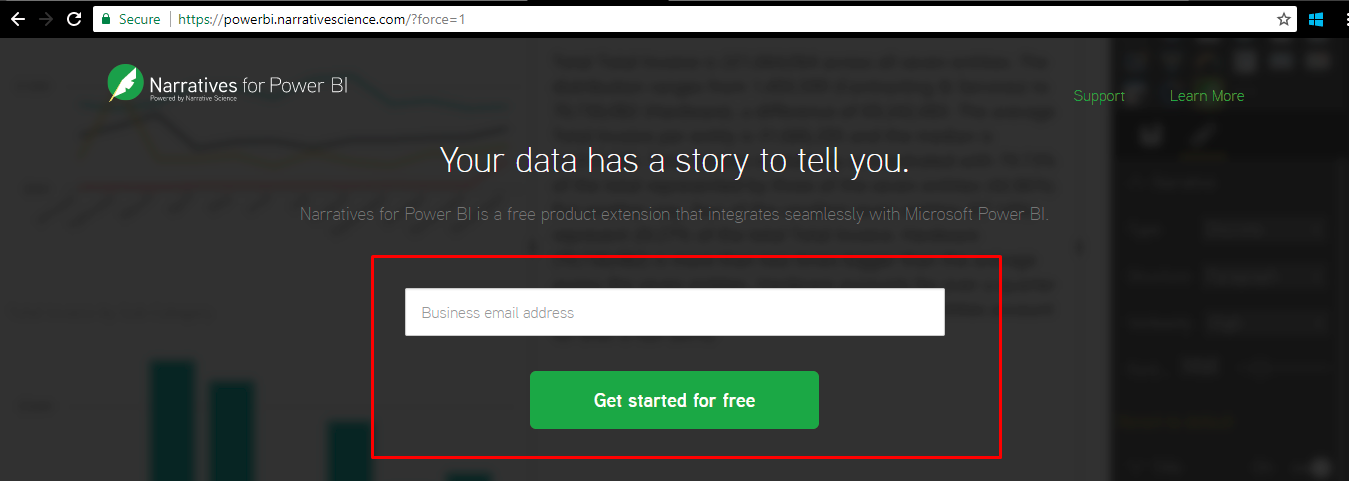
- Go to powerbi.narrativescience.com and enter your business email id.
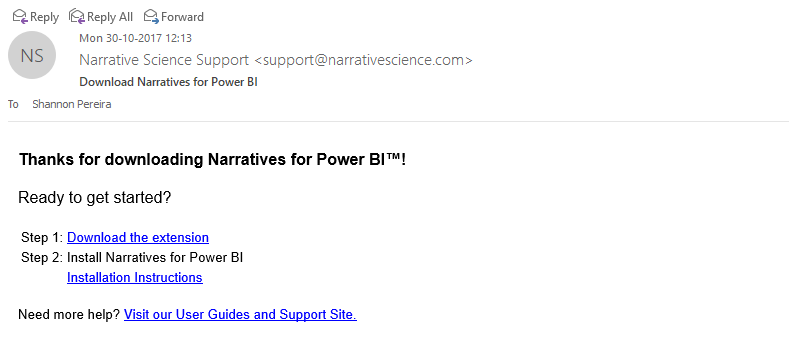 A link for downloading the extension and installation instructions will be mailed to you
 - A pibiviz file will be downloaded on downloading the extension. A pbiviz file is nothing but a custom visual which can be imported in Power BI Desktop.
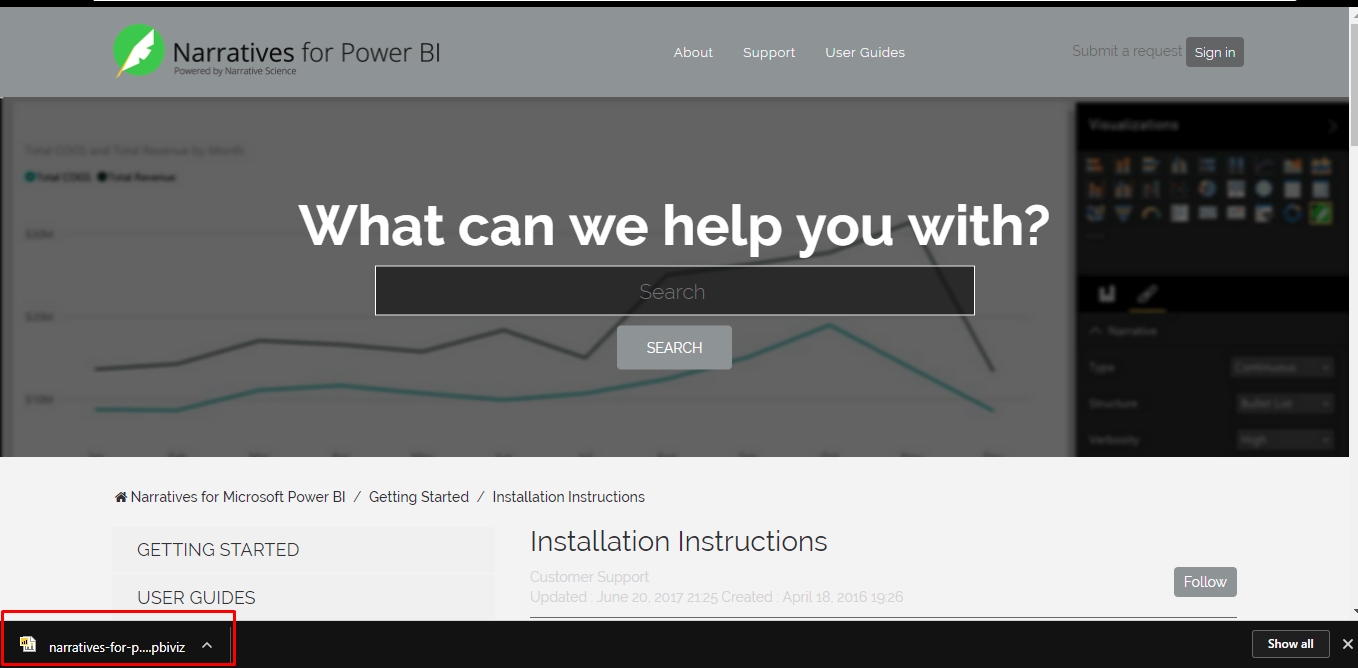
Narratives pbiviz file - Import the file on Power BI Desktop
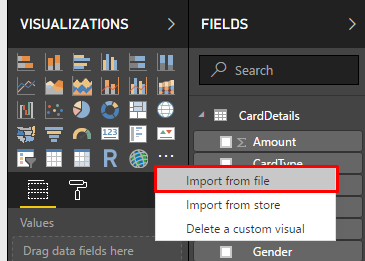
Import Narratives 
Narratives Icon - Benefits:
- Automated Narratives generated that give more detailed insights about the report which may not even be obvious
- Real time update on interaction with data
- Many customization options to personalize your narrative
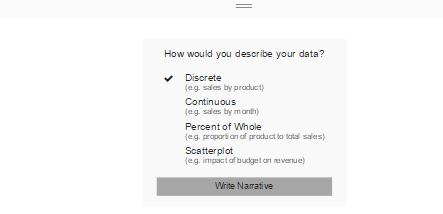
- Click on Narrative and select Dimensions and Values based on which Narratives will be generated. After selecting the fields you will have to select your narrative type.
- Discrete: For distinct data like that in Bar Charts
- Continuous: For continuous data like that in Line Charts
- Percent of Whole: For data by percentage like Pie Charts
- Scatterplot: For data based on scatterplot like Charts
Narratives Data Description
- A narrative gets generated
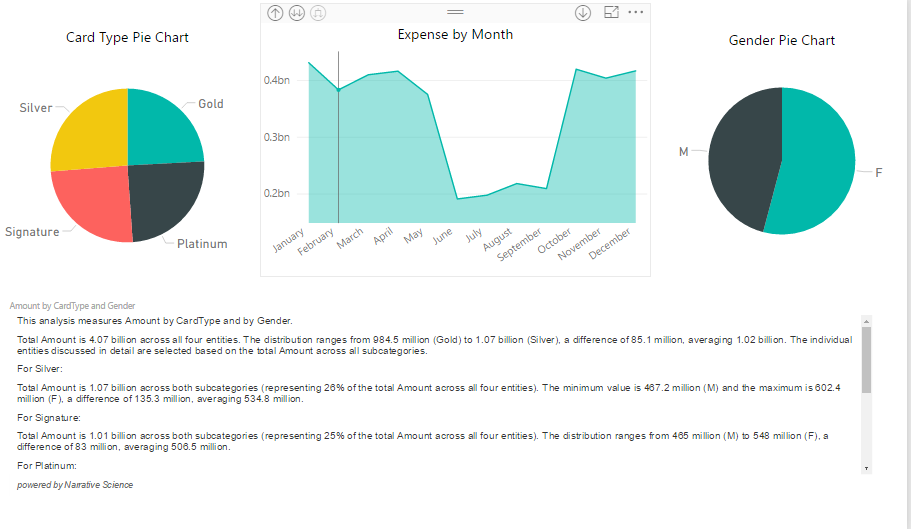
Narratives Generated It also changes on real time interaction
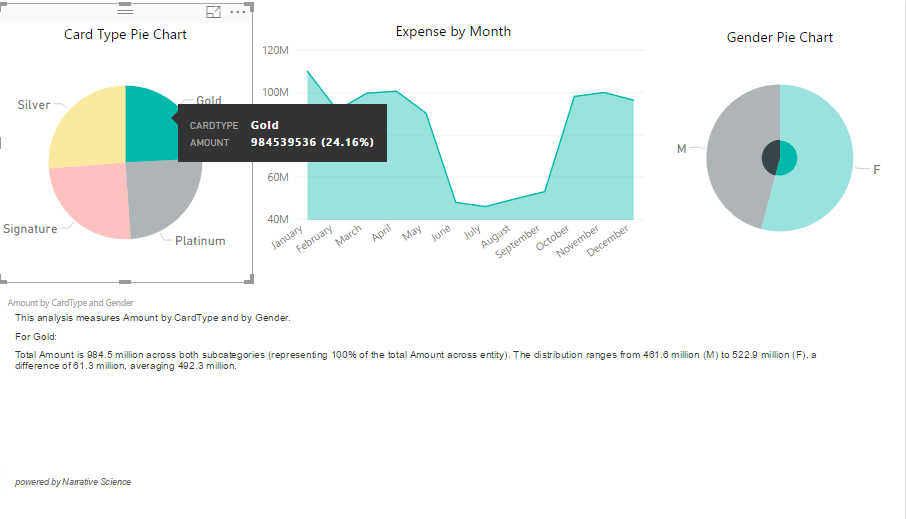
Real-Time Narratives - The type structure and verbosity can be customized in the Format Pane
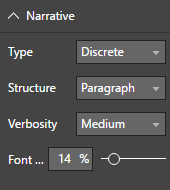
Narratives Customization - Type Can be Discrete, Continuous, Percent of Whole or Scatterplot.
- Structure can be either in Paragraph format or Bullet Points.
- Verbosity the level of information displayed. Low verbosity would show less detailed narrative with high level information while High verbosity would show a very detailed narrative. Medium verbosity would be a midway between both.
I hope this blog encourages you to use this powerful extension to improve your reports by making it as detailed as possible with minimalistic efforts!
