November 2017 Updates for PowerBI Desktop
Introduction:
In this blog article, I will talk about the November Updates for PowerBI Desktop.
Conditional Formatting based on Rules:
You can now set the colour of the text based on a predefined rule depending on your business logic. This enables you to colour-code your data based on a set of rules that you set based on your business logic.
To do this, go to the Conditional Formatting card and select the field you want to make changes to from the drop-down menu.
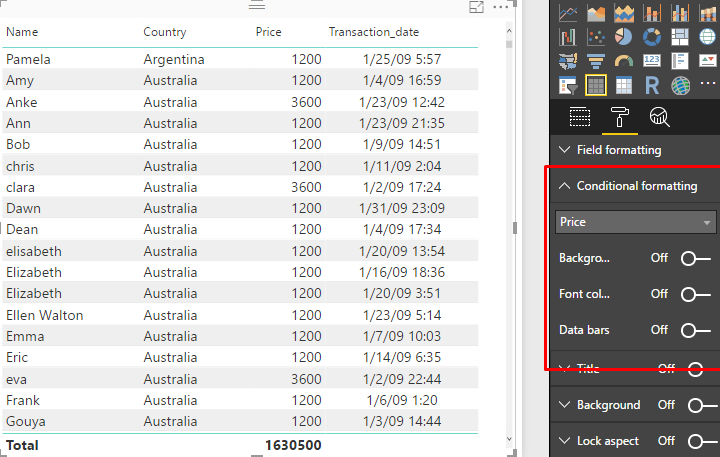
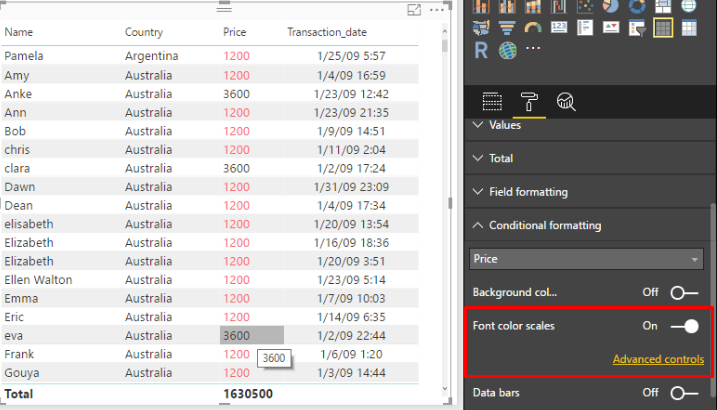
Switch the ‘Font Colour Scales’ option On and select ‘Advanced Controls’.
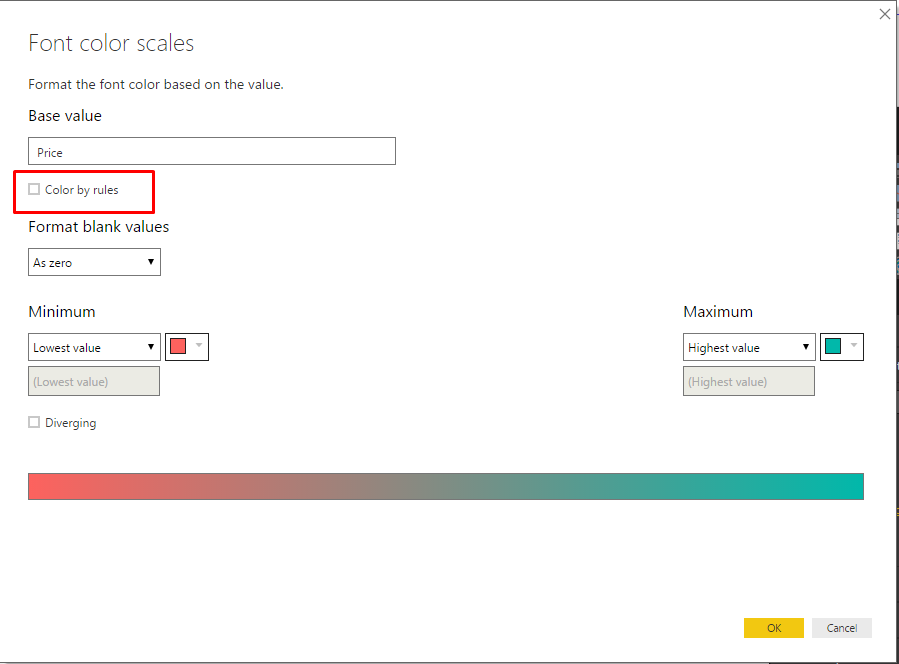
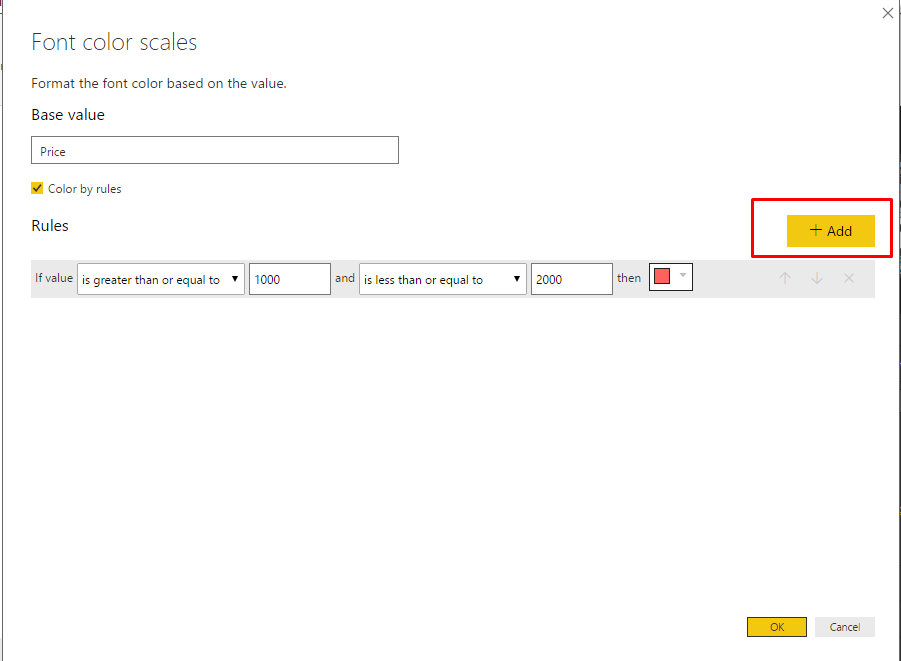
The general Font Colour Scales dialog box will open. Select the ‘Colour by rules’ checkbox.
The Rules pane is displayed. There are dropdown lists to select the conditions, text fields to set values and a colour selector to set the colour of the data that satisfies the condition. If left empty, they default to the Minimum and Maximum values.
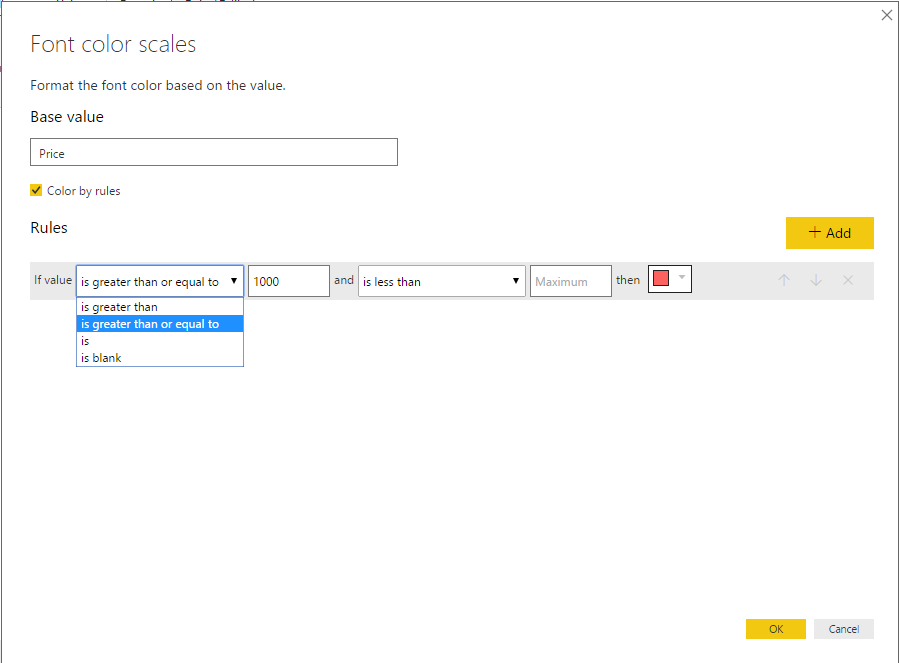
To add additional conditions, click the ‘Add’ button. Once done, click OK.
You will see the Conditional Formatting Rules being applied and the data being colour-coded accordingly.
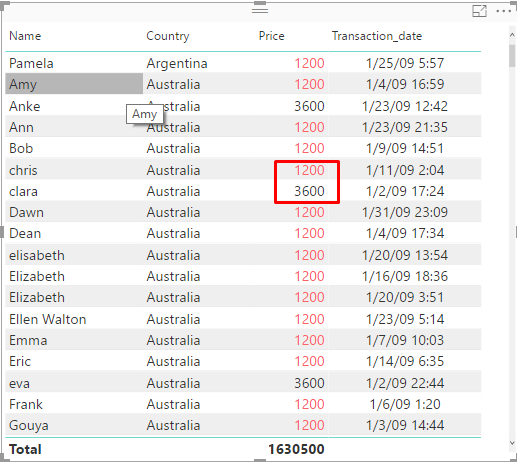
Also, if a data value satisfies multiple rules, the bottom rule applies.
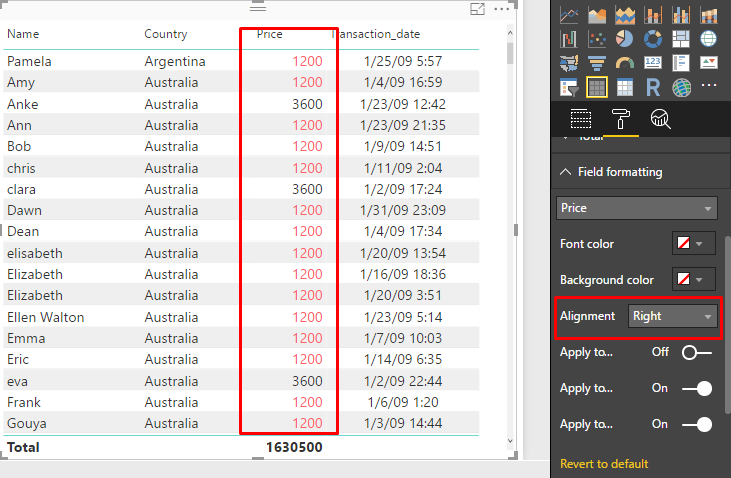
Cell Alignment for Table and Matrix:
Now, you can set the alignment of data to Left, Right or Center for cells in a table or matrix. This feature is very useful when formatting your report.
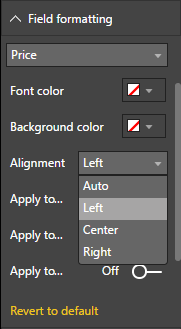
To do this, go to the Field Formatting card and select the field you want to make changes to.
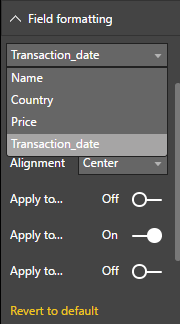
Go to the ‘Alignment’ option and select the alignment of your choice from the dropdown menu.
You will now see that all the data in the selected fields have been aligned according to your selection.
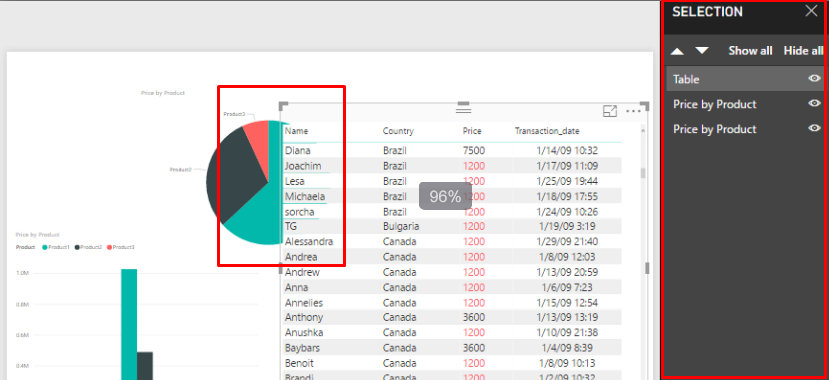
Selection Pane Update:
The Selection pane now has an added feature of letting the user select which objects are displayed on top of the canvas if there is overlapping.
Locking Report Objects:
There is now a checkbox called ‘Lock Objects’ that allows you to fix the position and the size of each object in a report so that no changes are accidentally made. This is very useful when browsing reports as the layout will not be affected.
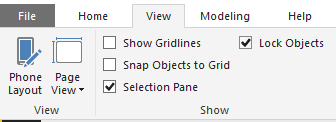
One thing to keep in mind is that this setting will not be saved with the report and to ensure this checkbox is ticked when browsing.
New options for slow/large data sources:
Sometimes, if you have a large or a slow data source, obtaining a response to actions taken in the report can take time. To improve this, options have been introduced to send fewer queries so that it is easier and quicker to interact with the report.
To enable this option, go to Options and settings in the File menu.
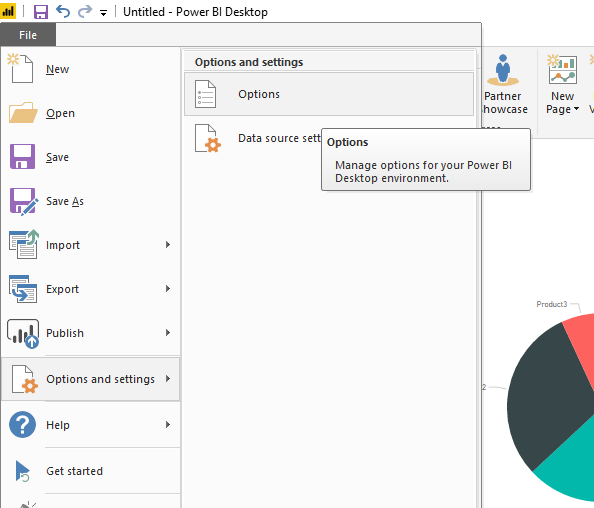
Select Options and then the Query Reduction tab. From here, you can disable cross-highlighting and automatic slicing and filtering within the report.
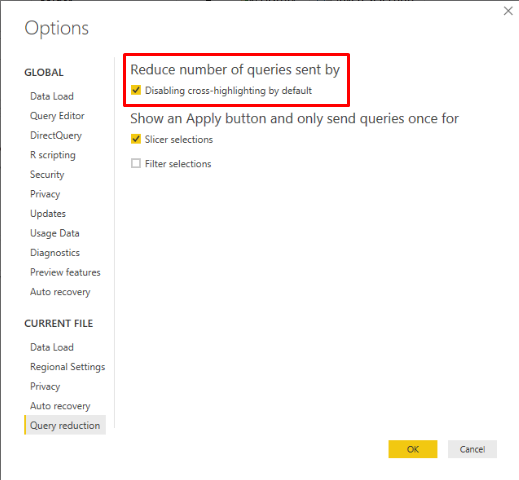
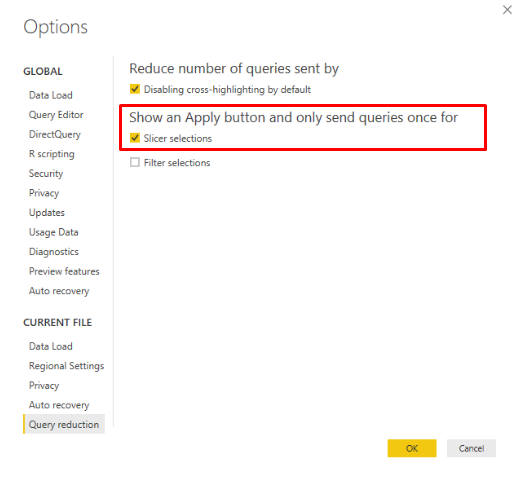
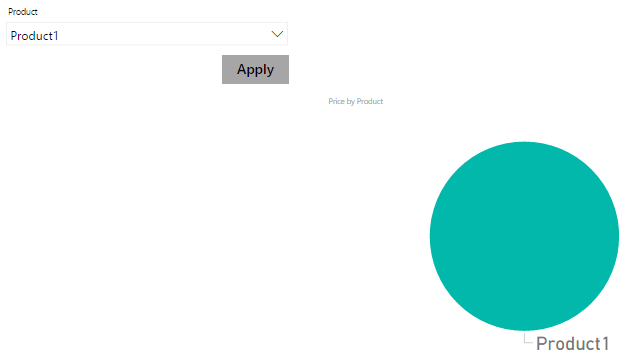
For slicing and filtering, an apply button can be added instead so that the report is only sliced/filtered once you click the ‘Apply’ button.
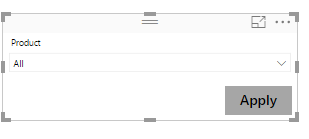
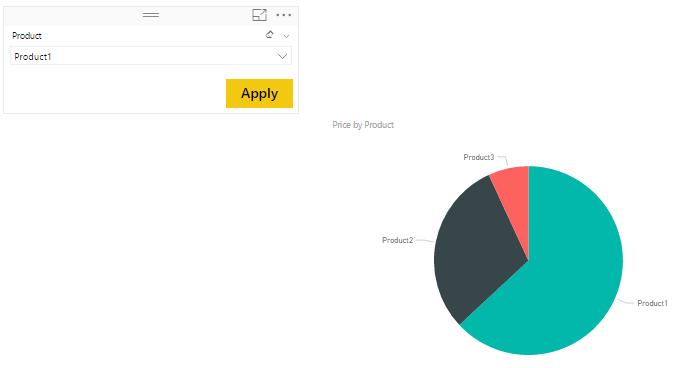
As you can see above, the pie chart is not sliced when ‘Product 1’ is selected. It is only sliced when the ‘Apply’ button is clicked as seen below.
Improvement in filtering:
The limit of 500 values on the number of values you can match when filtering has been removed. This is applicable for all data sources except Live connections to analysis services models.
Conclusion:
As you can see from above, the November Update is full of extremely useful features that further optimize the way we use PowerBI Desktop.
