Category Archives: Power BI
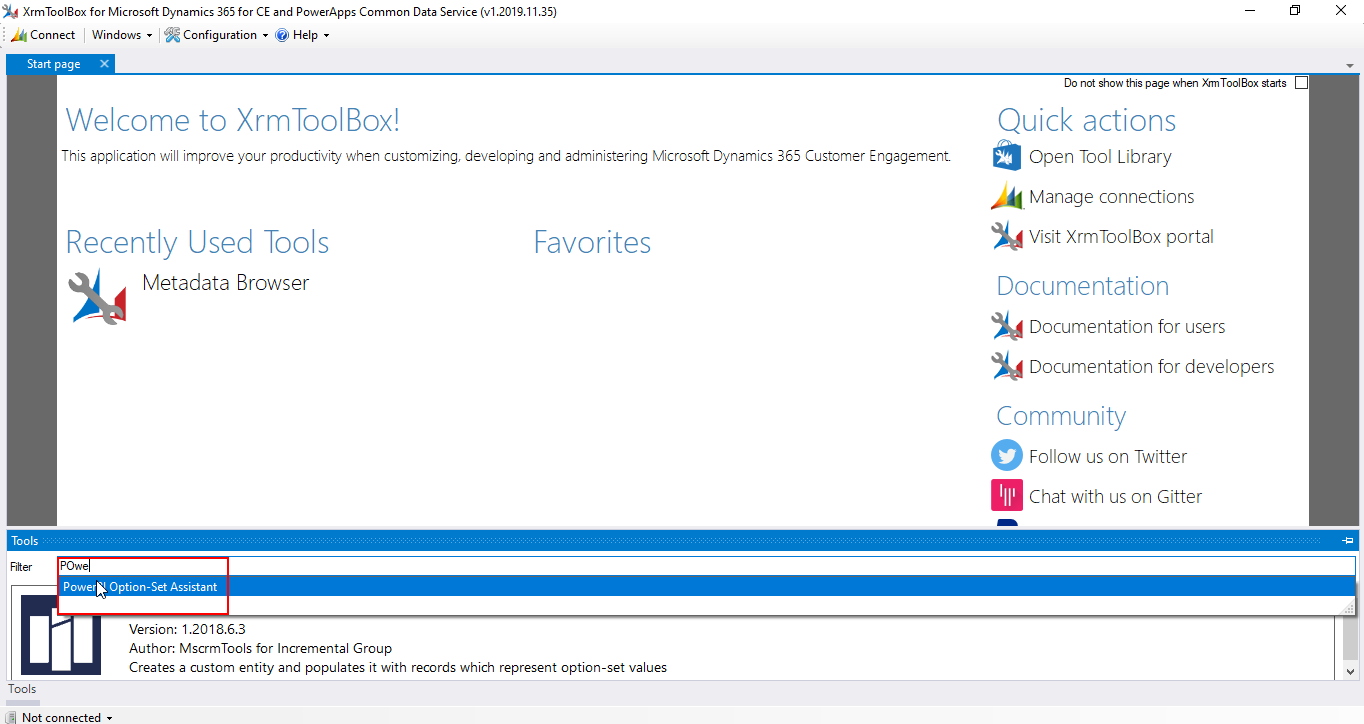
How to Install and Locate new Plugin in XRM
This Blog will show you how you can Install and locate your Plugins in XRM new interface.
Share Story :
Register an application entity in Azure Active Directory
The following steps are to be followed to register an application entity in Azure Active Directory:- Go to Azure Active Directory and Click on App Registrations. Click on New Registration, Enter a name and the Redirect URL and click Register. Copy and save the Application(client) ID and Tenant ID in a text file. Generate a key for the Client ID from Certificate & secrets section.Go to Certificate & secrets and click + New Client Secret.
Share Story :
Conditional Formatting by Row in a Matrix
Introduction: This blog will show you how you can color individual rows differently based on different conditions and the row headers in matrix (Not alternating rows). Our Scenario: I want to apply colors to different rows of the following Buckets: Current – No Color 1-30 Days Past Due – Yellow 31-60 Days Past Due – Orange 61-90 Days Past Due – Red 91 or More Days Past Due – Red Step 1: Create a new calculated column in your data source which applies a numeric value to each header type that you would like to have highlighted. We have created a Calculated Column using the following query. Step 2: Select the Matrix to which you want to apply the formatting and go to conditional formatting section in the Format Tab and turn the Background Color Option “On”. Step 3: The Conditional Formatting is applied for different fields in the Values section in the Matrix. So we will apply conditional formatting according to No. field first. Select Format by “Rules”. In Based on field select “Sum of Color Column” and in Summarization select “Sum”. In the Rules section add the Rule as shown in the Screenshot. Step 4: Apply the other rules for different colors same as above. Step 5: The Colors have been applied to different buckets according to our rule for “No.” Column. Step 6: Repeat the same steps by selecting different fields from the drop down under Conditional Formatting, one by one. Step 7: Thus we have colored the different rows of the Matrix successfully based on our condition.
Share Story :
How to create Date tables in Power BI. Why are they remarkably important in data models?
In this blog I am going to explain you how to create a Date table in Power BI desktop. A date table is a table that contains one column of DateTime type with unique values. It’s also called CALENDAR table A data model typically contains a date table A date table is designed to slice dates It should contain all dates included in the period to analyse It should contain one column of DateTime type Each day should be represented by a single a row There should be no gaps in the data It should be marked as a date table Using a date table with only the relevant year is best practise It’s recommended to have a rich set of additional columns Give the data model the flexibility to perform time intelligence calculations by using specific DAX functions Slice data by using one of its columns Create relationships between a date table and other tables in the data model Filter and group data across multiple tables Types of Date tables There are two ways to create a table Automatic Date Tables Power BI automatically creates a date table for each Date or DateTime column in the model. This makes it possible to slice each date by year, quarter, month and day. Calculated Date Tables It can be done by using two DAX functions: CALENDAR and CALENDARAUTO Syntax: Dates = CALENDAR(<StartDate>,<EndDate>) Dates = CALENDAR ( FIRSTDATE(Table[column]), LASTDATE(Table[column]) ) Calendar functions return a table with a single column named “Date” and a list of values for the dates. Calendar requires the boundaries of the set of dates. CalendarAuto searches among all the dates in the data model and automatically finds the first and last year referenced within the model. Dates = CALENDARAUTO() The final formula for the calculated table should look something like this: Date = ADDCOLUMNS ( CALENDAR (DATE(2018,1,1), DATE(2025,12,31)), “DateAsInteger”, FORMAT ([Date], “YYYYMMDD”), “Year”, YEAR ([Date]), “Monthnumber”, FORMAT ([Date], “MM”), “YearMonthnumber”, FORMAT ([Date], “YYYY/MM”), “YearMonthShort”, FORMAT ([Date], “YYYY/mmm”), “MonthNameShort”, FORMAT ([Date], “mmm”), “MonthNameLong”, FORMAT ([Date], “mmmm”), “DayOfWeekNumber”, WEEKDAY ([Date]), “DayOfWeek”, FORMAT ([Date], “dddd”), “DayOfWeekShort”, FORMAT ([Date], “ddd”), “Quarter”, “Q” & FORMAT ([Date], “Q”), “YearQuarter”, FORMAT ([Date], “YYYY”) & “/Q” & FORMAT ([Date], “Q”) ) Once the date table is in place, it is a good idea to mark it as a date table as shown here: This both simplifies the code to author time intelligence calculations and automatically disables the auto Date/Time feature. I hope this will help you.
Share Story :
Auto scale the Power BI Embedded capacity using Job Scheduler in Azure
Power BI Embedded is a Microsoft Azure service that is useful for the ISVs and developers to embed visuals, reports and even dashboard into the application. As Power BI Embedded is a PaaS analytics solution which provide Azure based capacity, Power BI embedded charge customers on an hourly basis there are n annual commitment for the Power BI Embedded service. As Power BI Embedded charges on hourly basis and there is no direct Auto Scaling feature available on Azure but, we do have API provided by using which we can scale the capacity. In this blog we are going to see how scale the Power BI Embedded capacity using PowerShell script. Before going to start we’ll first quick list the set up the prerequisites: You will need an Azure account, if you are implementing the PowerShell script for your organisation then you must have co-administrator role assign kindly keep in mind that if you have contributor role assign then you’ll not be able to make Automation account.(we’ll see about the Automation account in the later part of this blog.) Power BI Embedded subscription. Automation Account. I’m assuming you already have Azure account along with the subscription for the Power BI Embedded. Steps:- Create Automation Account:- Automation account is use to manage the Azure resource across all the subscription for the given tenant. To create Automation click on the create resource in your Azure portal as shown below and search for Automation account. Or you can type in search box Automation Account. 2. Click on create Automation Account and make sure to fill the following details. If you have multiple subscription then make sure to select proper subscription from drop-down. Make sure create Azure Run As account is selected to Yes (if you are co-administrator or administrator then it will by default selected to Yes). Once we create Azure automation account it will show under automation account. 3. Open the Automation account and go to the Connections and add below connection and types as shown below (Click on Add a connection and type the name and type as shown below) 4. For the AzureClassicRunAsConnection set the CertificateAssetName to AzureRunAsCertificate. 5. Add the Power BI Embedded subscription to your resource group. 6. Once we have Automation account ready go to the Runbooks under Process Automation in Automation Account. Runbook is useful for the routine procedures and operations. We can also use Azure Function app instead of Runbook. 7. Click on the Create a runbook and use fill following details. 8. Once we open runbook make sure to import the Module AzureRM.PowerBIEmbedded which can be installed by going to Module under Shared Resources then click on Browse gallery and search for the AzureRM.PowerBIEmbedded module. 9. Use the below PowerShell script which can also be found on the Power BI discussion site. $resourceGroupName = “<your resource group>” $instanceName = “<Power BI embedded instance name>” $azureProfilePath = “” $azureRunAsConnectionName = “AzureRunAsConnection” #”PowerBIAutoscale” $configStr = “ [ { Name: “”Weekday Heavy Load Hours”” ,WeekDays:[1,2,3,4,5] ,StartTime: “”06:45:00″” ,StopTime: “”23:45:00″” ,Sku: “”A4″” } , { Name: “”Early AM Hours”” ,WeekDays:[0,1,2,3,4,5,6] ,StartTime: “”00:00:00″” ,StopTime: “”04:44:00″” ,Sku: “”A1″” } , { Name: “”Model Refresh”” ,WeekDays:[0,1,2,3,4,5,6] ,StartTime: “”04:45:00″” ,StopTime: “”06:45:00″” ,Sku: “”A3″” } , { Name: “”Weekend Operational Hours”” ,WeekDays:[6,0] ,StartTime: “”06:45:00″” ,StopTime: “”18:00:00″” ,Sku: “”A3″” } ] “ $VerbosePreference = “Continue” $ErrorActionPreference = “Stop” Import-Module “AzureRM.PowerBIEmbedded” Write-Verbose “Logging in to Azure…” # Load the profile from local file if (-not [string]::IsNullOrEmpty($azureProfilePath)) { Import-AzureRmContext -Path $azureProfilePath | Out-Null } # Load the profile from Azure Automation RunAS connection elseif (-not [string]::IsNullOrEmpty($azureRunAsConnectionName)) { $runAsConnectionProfile = Get-AutomationConnection -Name $azureRunAsConnectionName Add-AzureRmAccount -ServicePrincipal -TenantId $runAsConnectionProfile.TenantId ` -ApplicationId $runAsConnectionProfile.ApplicationId -CertificateThumbprint $runAsConnectionProfile.CertificateThumbprint | Out-Null } # Interactive Login else { Add-AzureRmAccount | Out-Null } $fmt = “MM/dd/yyyy HH:mm:ss” # format string $culture = [Globalization.CultureInfo]::InvariantCulture $startTime = Get-Date Write-Verbose “Current Local Time: $($startTime)” $startTime = [System.TimeZoneInfo]::ConvertTimeBySystemTimeZoneId($startTime, [System.TimeZoneInfo]::Local.Id, ‘Eastern Standard Time’) Write-Verbose “Current Time EST: $($startTime)” $scheduleTimeMidnight = ($startTime).Date Write-Verbose “Schedule Time Base (Midnight): $($scheduleTimeMidnight)” $currentDayOfWeek = [Int]($scheduleTimeMidnight).DayOfWeek Write-Verbose “DOW: $($currentDayOfWeek)” $stateConfig = $configStr | ConvertFrom-Json #| Select-Object Sku, WeekDays, Name, StartTime, EndTime #, @{Name=”StartTime”; Expression={[DateTime]:Smiley TonguearseExact($_.StartTime, $fmt, $culture)}}, @{Name=”StopTime”; Expression={[DateTime]:Smiley TonguearseExact($_.StopTime, $fmt, $culture)}} Write-Verbose “Writing Config Objects…” foreach($x in $stateConfig) { Write-Verbose “Name: $($x.Name)” Write-Verbose “Weekdays: $($x.WeekDays -join ‘,’)” $x.StartTime = ($scheduleTimeMidnight).AddHours([int]$x.StartTime.Split(“{:}”)[0]).AddMinutes([int]$x.StartTime.Split(“{:}”)[1]).AddSeconds([int]$x.StartTime.Split(“{:}”)[2]) Write-Verbose “Start Time: $($x.StartTime)” $x.StopTime = ($scheduleTimeMidnight).AddHours([int]$x.StopTime.Split(“{:}”)[0]).AddMinutes([int]$x.StopTime.Split(“{:}”)[1]).AddSeconds([int]$x.StopTime.Split(“{:}”)[2]) Write-Verbose “End Time: $($x.StopTime)” } Write-Verbose “Getting current status…” # Get the server status $pbiService = Get-AzureRmPowerBIEmbeddedCapacity -ResourceGroupName $resourceGroupName switch ($pbiService.State) { “Scaling” { Write-Verbose “Service scaling operation in progress… Aborting.” end } “Succeeded” {Write-Verbose “Current Status: Running”} Default {Write-Verbose “Current Status: $($pbiService.State)”} } Write-Verbose “Current Capacity: $($pbiService.Sku)” # Find a match in the config $dayObjects = $stateConfig | Where-Object {$_.WeekDays -contains $currentDayOfWeek } # If no matching day then exit if($dayObjects -ne $null){ # Can’t treat several objects for same time-frame, if there’s more than one, pick first $matchingObject = $dayObjects | Where-Object { ($startTime -ge $_.StartTime) -and ($startTime -lt $_.StopTime) } | Select-Object -First 1 if($matchingObject -ne $null) { Write-Verbose “Current Config Object” Write-Verbose $matchingObject.Name Write-Verbose “Weekdays: $($matchingObject.WeekDays -join ‘,’)” Write-Verbose “SKU: $($matchingObject.Sku)” Write-Verbose “Start Time: $($matchingObject.StartTime)” Write-Verbose “End Time: $($matchingObject.StopTime)” # if Paused resume if($pbiService.State -eq “Paused”) { Write-Verbose “The service is Paused. Resuming the Instance” $pbiService = Resume-AzureRmPowerBIEmbeddedCapacity -Name $instanceName -ResourceGroupName $resourceGroupName -PassThru -Verbose } # Change the SKU if needed if($pbiService.Sku -ne $matchingObject.Sku) { Write-Verbose “Updating Capacity Tier from $($pbiService.Sku) to $($matchingObject.Sku)” Update-AzureRmPowerBIEmbeddedCapacity -Name $instanceName -sku $matchingObject.Sku } } else { Write-Verbose “No Interval Found. Checking current capacity tier.” if($pbiService.Sku -ne “A2”) { Write-Verbose “No Interval Found. Scaling to A2” Write-Verbose “Updating Capacity Tier from $($pbiService.Sku) to A2” Update-AzureRmPowerBIEmbeddedCapacity -Name $instanceName -sku $matchingObject.Sku } } } else { Write-Verbose “No Interval Found. Checking current capacity tier.” if($pbiService.Sku -ne “A2”) { Write-Verbose “No Interval Found. Scaling to A2” Write-Verbose “Updating Capacity Tier from $($pbiService.Sku) to A2” Update-AzureRmPowerBIEmbeddedCapacity -Name $instanceName -sku $matchingObject.Sku } } Write-Verbose “Done!” 10. Above script not includes Capacity pause, we can add that in the script. 11. Once we done with the script click on Save and the Publish the script. 12. Create the Schedule under the Shared Resources … Continue reading Auto scale the Power BI Embedded capacity using Job Scheduler in Azure
Share Story :
Embedding Power BI reports into Webpages- Part 1
In this blog we are going to embed a Power BI report into webpage, to do so below are the steps, 1. Go to https://app.powerbi.com/ and create new report or we can publish already created report, in this case, we have one sample report, which contain three pages Page1: Team Scorecard Page2: Industry Margin Analysis Page3: Executive Scorecard 2. Open the report to be embedded and Go to File ->embed Upon clicking on Embed, we will get following popup, which contain link that can be used for embedding and HTML code. 3. Now we have to paste the html code into HTML page, we can edit the iframe height and width 4. Now open the HTML page in the web browser then we can see the Power BI Report, in this, we can apply the filter, when we load the HTML page then we need to sign in. In this way, we can embed Power BI reports into Webpages.
Share Story :
Embedding Power BI reports into Webpages- Part 2
In this blog we going to Set which page to open when the Power BI report is embedded We can do the customization in the embed code as per requirement for the page loading. We have to open the report and click on each page and note down the URL to get page name So report page names are, Team Scorecard: ReportSection2 Industry Margin Analysis: ReportSection Executive Scorecard: ReportSection1 2. We have to append the code &pageName=ReportPageTabName to the URL e.g. https://app.powerbi.com/reportEmbed?reportId=c772790a-7b9f-43fb-99eb-42f560e95cf6&autoAuth=true&ctid=26c4b2e4-ec07-4c7b-92e5-97f52865e98b&config=eyJjbHVzdGVyVXJsIjoiaHR0cHM6Ly93YWJpLXNvdXRoLWVhc3QtYXNpYS1yZWRpcmVjdC5hbmFseXNpcy53aW5kb3dzLm5ldCJ9&pageName=ReportSection 3. We can do change in the URL for all report pages, embed in the webpage,below is HTML and JavaScript code for doing customization 4. When we open this page in web browser it will look like, when we click on any button to load report it will be loaded or we can set the default report page to load when the webpage is opened. 5. When we click first button i.e. Team Scorecard first page of the report will load Similarly for other pages, In this way we can embed Power BI report in webpages and do customization.
Share Story :
How to use a Custom URL for your text column in Power BI
In this blog I am going to explain you how to create a custom URL for your text column in Power BI desktop. You can create hyperlinks in tables and matrix in Power BI desktop. Before jumping to use a new feature in Power BI desktop, I am showing you how we had done previously. Step 1: Import sample data in Power BI desktop. Step 2: If the hyperlink doesn’t already exist as a field in your dataset, use Power BI Desktop to add it as custom column like “WebURL”. Step 3: In Data view, select the column and in the Modeling tab choose the dropdown for Data Category. Step 4: Select Web URL. Step 5: Switch to Report view and create a table or matrix using the field categorized as a Web URL. The hyperlinks will be blue and underlined. Step 5: If you don’t want to display a long URL in a table, you can display a hyperlink icon instead. Note that you can’t display icon in matrix. Select the table to make it active. Select the Format icon to open the Formatting tab. Expand Values, Iocate URL icon, and turn it on. Step 6: Now we want a web link on custom column, so first we uncategorized the WebURL column. In Data view, select the column and in the Modeling tab choose the dropdown for Data Category. Step 7: Switch to Report view and remove the WebURL column from the table. Select the table to make it active. Select the Format icon to open the Formatting tab. Expand Conditional formatting, select filed that you want to active hyperlink and locate Web URL, and turn it on. Step 8: Turn Web URL on, one popup will be appeared in this you have to select WebURL field and click on OK button. Step 9: Result look like below screenshot, now you hover on column field you can clearly see the hyperlink. I hope this will help you.
Share Story :
Send an e-mail to any audience when Power BI data alert is triggered
In this blog I am going to explain you how to send an e-mail to any audience when a Power BI data alert is triggered. Step 1: Create a sample of Power BI report using visuals like gauge, KPI or card title. Step 2: Publish your Power BI report on app.powerbi.com site. Step 3: Pin individual visuals like gauge, KPI or card title. Step 4: Go to dashboard page, select chart and click on ellipsis Step 5: Click on Manage alerts, click on Add alert rule Here you can set the threshold condition and based on above and below amount. Also set maximum notification frequency either at most every 24 hours or at most once an hour. Step 5: Login to https://flow.microsoft.com/ Step 6: Create a Templates “Send an e-mail to any audience when a power BI data alert Is triggered” After clicking on continue button Set Alert Id that have been created on manage alert in Power BI. Click on Save button. Step 7: Whenever data changes on Power BI dataset and alert rule condition satisfied this Power Automate flow is triggered and send mail to target audiences. I hope this will help you.
Share Story :
Add effects to Power BI Buttons
Hello Friends, in this blog we will see how to add effects to Power BI buttons. Steps: Open Power BI desktop and select blank button from ribbon. Now add a rectangular strip to your button to look more attractive with the following configuration. Now add another button with transparency 50 % in default state just to create the feel of not focused state. Make sure to turn off background. Add hover state configuration for fill property of newly added button. Place the button on your old button. Final button will look like this. You can add click state for button Hope this helps.
Share Story :
SEARCH BLOGS:

Anil Shah, CEO
Lorem ipsum dolor sit amet, consectetur adipiscing elit. Ut elit tellus, luctus nec ullamcorper mattis, pulvinar dapibus leo.