How to Track and Debug Job Queue Failures in Business Central for a Cameroon-Based Consulting Company
Summary
This blog explains how to effectively track and debug job queue failures in Microsoft Dynamics 365 Business Central.
In many Business Central implementations, job queues are used to automate critical background processes such as posting transactions, sending emails, synchronizing data, and running reports. However, when these jobs fail, identifying the root cause can become challenging due to limited visibility and lack of proper debugging practices.
This blog provides a structured approach to monitor job queue failures, analyze error logs, and debug issues efficiently using built-in tools and development techniques.
This blog explains:
1] Common reasons behind job queue failures
2] How to track failed job queue entries
3] How to debug job queue errors using AL
4] Best practices for logging and monitoring
5] Business impact of efficient job queue handling
Table of Contents
- Customer Scenario
- Solution Overview
- Functional Implementation Approach
- Debugging Job Queue Failures
- Handling Complex Scenarios
- Business Impact
- Preview Video
- Final Thoughts
Customer Scenario
A growing organization using Microsoft Dynamics 365 Business Central had automated multiple backend processes using Job Queues. These included:
1] Automatic posting of invoices
2] Scheduled report generation
3] Email notifications to customers
4] Data synchronization with external systems
While automation improved efficiency, the team started facing frequent job queue failures.
The challenges included:
1] No clear visibility of why jobs were failing
2] Errors appearing without sufficient details
3] Delays in critical processes like posting and integrations
4] Manual intervention required to restart failed jobs
5] Increased dependency on technical teams
Since job queues run in the background, users were often unaware of failures until business operations were impacted.
The organization needed a structured way to track, analyze, and debug job queue failures efficiently.
Solution Overview
To address these challenges, a systematic approach was implemented to monitor and debug job queue failures within Business Central.
The goal was simple: Enable quick identification and resolution of job queue failures with minimal effort.
With this approach:
- a. Support teams can monitor job queue entries in real time
- b. Failed jobs can be analyzed using error messages and logs
- c. Developers can debug the underlying AL code effectively
- d. Recurring failures can be prevented using better error handling
The workflow now looks like this:
- a. A job queue is scheduled to run a specific process
- b. The system executes the job in the background
- c. If the job fails, the status changes to Error
- d. Error details are captured in the Job Queue Log Entries
- e. The support/development team reviews and debugs the issue
- d. The job is corrected and rescheduled
Functional Implementation Approach
The implementation focuses on improving visibility, debugging capability, and system reliability.
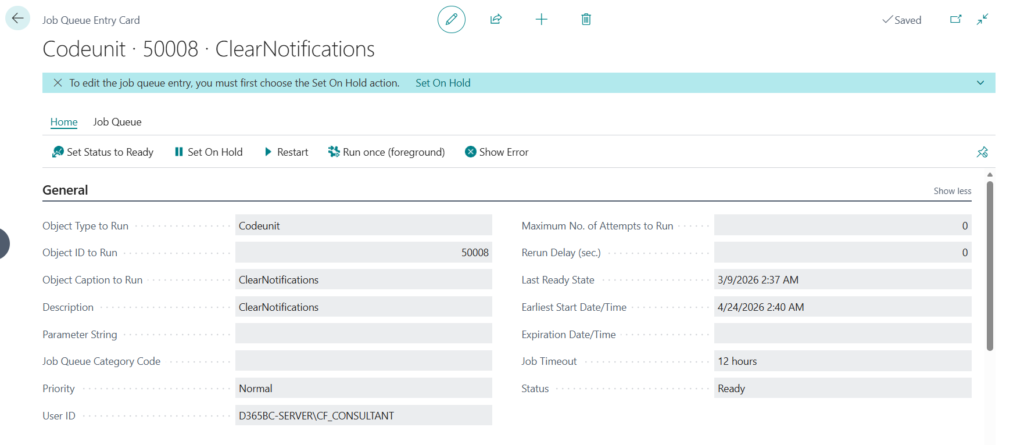
Monitoring Job Queue Entries
Business Central provides a dedicated Job Queue Entries page where all scheduled jobs are listed.
Key fields to monitor:
1] Status (Ready, In Process, Error)
2] Earliest Start Date/Time
3] Recurrence settings
4] Object Type and Object ID
5] Last Error Message
When a job fails, the status changes to Error, which becomes the primary trigger for investigation.
Analyzing Job Queue Log Entries
Each job queue execution creates log entries that store execution details.
These logs provide:
1] Error messages
2] Execution time
3] Call stack (in some cases)
4] Number of attempts
This is the first place to check when debugging a failure.
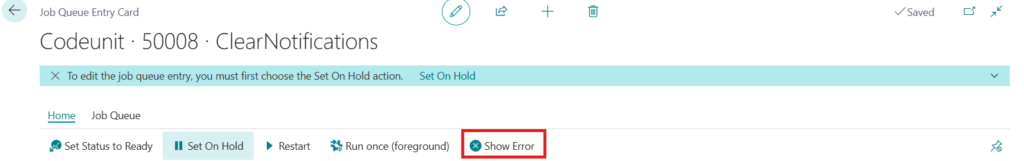
Using “Show Error” Functionality
The “Show Error” action provides detailed error messages generated during execution.
This helps identify:
1] Missing data
2] Invalid field values
3] Permission issues
4] Posting errors
Debugging Job Queue Failures
Debugging job queues requires a slightly different approach compared to normal execution.
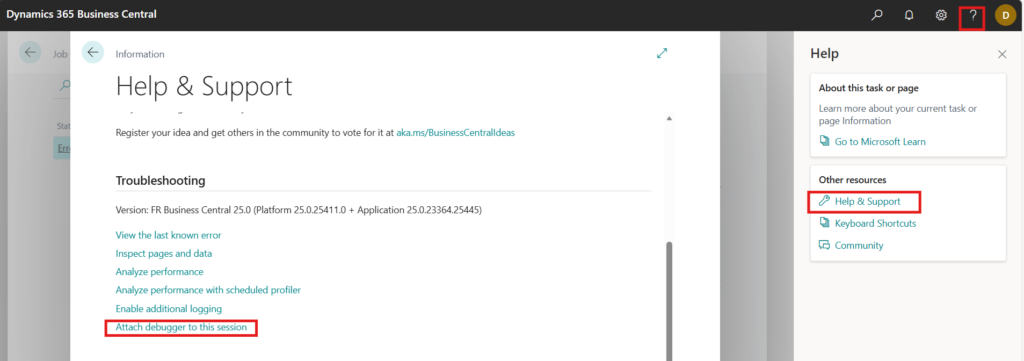
Attaching Debugger to Session
Since job queues execute in the background, debugging requires attaching to the active session where the job is running.
Steps:
1] Go to Help and Support page
2] Click on Attach Debugger to this Session
3] Set breakpoints in the relevant codeunit
4] Trigger or wait for the job queue to execute
This method allows you to debug the exact session where the job queue is running, making it easier to trace issues in real time.
Using Breakpoints in Codeunits
Most job queues run codeunits.
Developers should:
1] Identify the Codeunit ID from Job Queue Entry
2] Add breakpoints in key logic areas
3] Re-run the job queue
4] Step through execution
Common Causes of Failures
Some frequent reasons include:
1] Missing mandatory fields
2] Incorrect filters in code
3] Permission issues for background user
4] Deadlocks or record locking
5] Integration/API failures
Handling Complex Scenarios
In real-world implementations, job queue failures can involve complex scenarios.
Logging Custom Errors
Developers can enhance debugging by adding custom logs in AL code.
For example:
1] Logging key variable values
2] Capturing intermediate processing steps
3] Writing meaningful error messages
This makes troubleshooting faster and more accurate.
Retry Mechanism
Job queues support automatic retries.
Proper configuration ensures:
1] Temporary issues are resolved automatically
2] Manual intervention is minimized
3] System resilience improves
Handling Integration Failures
When job queues interact with external systems:
1] API timeouts must be handled
2] Response validation should be implemented
3] Retry logic should be added
Business Impact
1] Reduced Downtime
Quick identification of job queue failures ensures minimal disruption to business operations.
2] Improved System Reliability
With proper monitoring and debugging, automated processes become more stable.
3] Increased Developer Productivity
Developers spend less time identifying issues and more time resolving them.
4] Faster Issue Resolution
Clear logs and debugging techniques reduce troubleshooting time significantly.
5] Scalable Automation
Organizations can confidently automate more processes without fear of silent failures.
Preview Video
The preview video demonstrates how to track and debug job queue failures in Business Central.
Video highlights:
Opening Job Queue Entries page
Identifying failed jobs
Viewing Job Queue Log Entries
Using “Show Error” functionality
Attaching debugger from Visual Studio Code
Demo: Debugging a Job Queue Failure in Business Central
Final Thoughts
Job queues are a powerful feature in Microsoft Dynamics 365 Business Central that enable automation of critical business processes.
However, without proper monitoring and debugging practices, failures can go unnoticed and impact operations.
By implementing structured tracking, logging, and debugging techniques, organizations can transform job queue management from a reactive process into a proactive one.
What was once a difficult and time-consuming troubleshooting activity can now be handled efficiently with the right approach—ensuring smooth and reliable system performance.
If your Business Central environment is facing recurring job queue failures or requires optimization of background processes, consider implementing structured debugging and monitoring practices to improve overall system efficiency.
Connect with CloudFront’s to get started at transform@cloudfonts.com.
