Power BI new updates: Date slicer, Top N Filter and Data label improvements
In this blog article, we will explain about the new updates of Power BI related to Date Slicer, Top N Filter and Data label improvements.
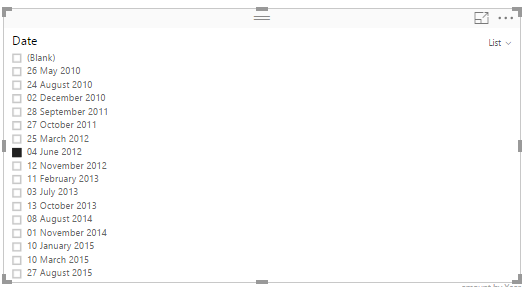
In Date slicer, earlier there were only one option to show the data i.e. list. But now we have four option as before, after, between and list. Means we will show data by choosing the date range as between, after, or before selected date. Also, we can move the slider to set date.
Date Slicer:
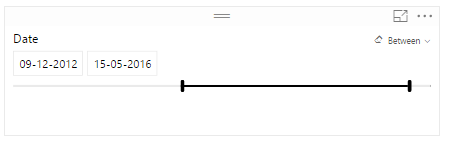
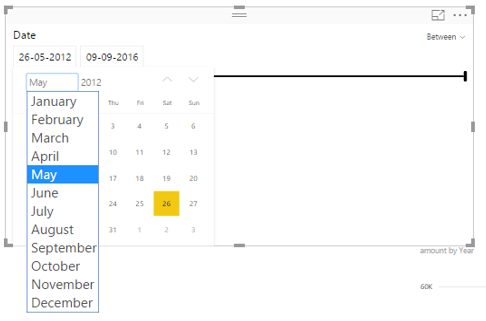
While using date slicer we can use either slider to set the dates or pick the date using a calendar or also we can manually insert date: –
The following are the four option that we can choose on date Slicer:
- Between
- Before
- After
- List
We can change the mode to before or after if we only need to control the last or first date used on reports page.
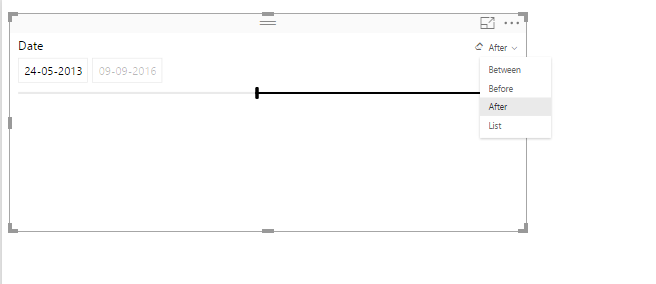
Or also we switch back to the standard List view
Top N:
Earlier we had only two filtering condition these are
- Advanced filtering
- Basic filtering
But now there is one more option i.e. Top N
By using this filtering condition, we can display the Top or Bottom N records.
We will find the top N filter in the filter pane as a filter type option for the category field we want to filter down.
Top N filter is use to retrieve the top or bottom N records. In this we can specify the numbers of items to show or display.
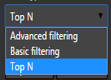
For example:
select Top or Bottom from option set and specify value as 10
Then it will retrieve Top or Bottom 10 records from the table with specified value.
Data Label improvements:
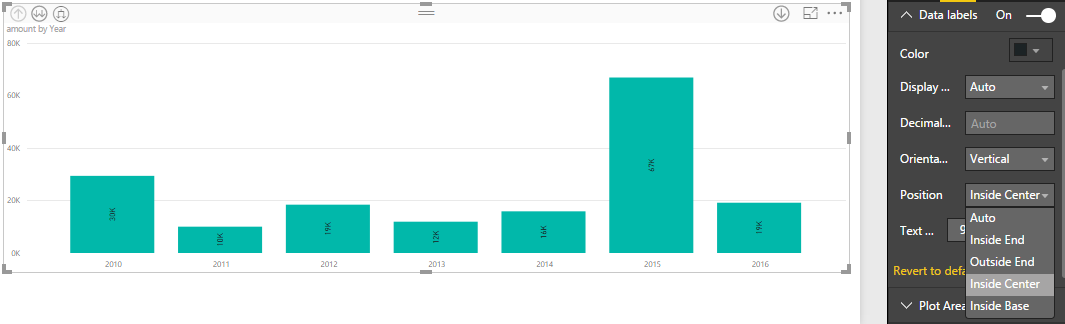
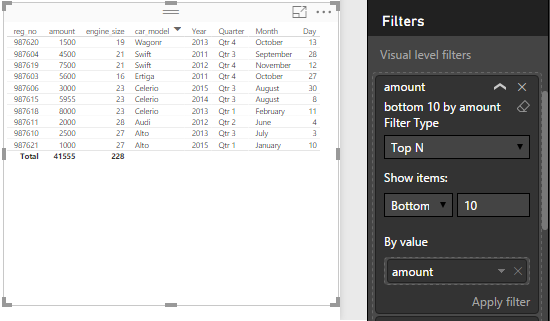
In data label, there added several new data label capabilities to column, bar and waterfall charts to help our design for our visuals with labels.
For column charts, now we have the option to change the orientation of the data labels between horizontal and vertical. This will help to fit longer data labels when we have skinnier columns.
Also for column, bar and waterfall charts we can change the position of the data labels.
We have the following option to set the position of data labels: –
- Inside End
- Outside End
- Inside Center
- Inside base